Download
1 / 16
160 likes | 309 Views
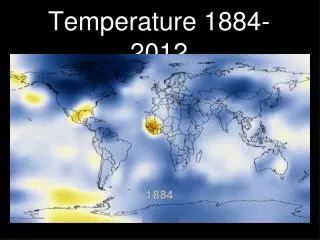
Temperature 1884-2012. Climate Change and Solar Radiation. Beate G Liepert NorthWest Research Associates - Redmond WA.

E N D
Climate Change and Solar Radiation Beate G Liepert NorthWest Research Associates - Redmond WA
This graph, based on the comparison of atmospheric samples contained in ice cores and more recent direct measurements, provides evidence that atmospheric CO2 has increased since the Industrial Revolution. (Source: NOAA)
Feedback Loops • Water vapor 7% per oC • Sea ice • Clouds • Ground reflectivity • Biosphere (land & ocean) In the absence of any feedbacks sensitivity would be 1oC
Image credit: NASA/GSFC/LaRC/JPL MISR Team Mt. Etna Eruption 22 July 2001
Jet Stream - N America Northward shift of jet stream expected in 21st Century Flood Year Drought Year
Wild Fires Expected doubling of wild fires by 2050 Visible image of California's Rim Fire acquired Aug. 23, 2013 by the Multi-angle Imaging SpectroRadiometer (MISR) on NASA's Terra spacecraft, showing extensive, brownish smoke. The imaged area measures 236 by 215 miles (380 by 346 kilometers). Image: NASA/GSFC/LaRC/JPL, MISR Team Aug. 31
Pinatubo 1991 20thC Global Dimming (Romanou et al. 2007 GRL) Temperature Change +0.4 to +0.7oC +1W/m2 1984-2000 Dimming -1 to - 4 W/m2
Top: all sky surface solar radiation Satellite based estimates of changes from 1984 to 2000 Middle: cloud-free sky surface solar radiation (Romanou, et al. GRL 2007, see also Pinker et al. Science 2005) Bottom: total cloud coverage change
Global Dimming: Climate Model Estimates Sensitivity of SWD climate simulations with various forcings: GHGs, tropospheric aerosols, 1st indirect effect, 1st and 2nd indirect effect and tropospheric ozone only. Units are in W/m2 / 100 years


![Edward Sapir [1884-1939]](https://cdn0.slideserve.com/1084146/edward-sapir-1884-1939-dt.jpg)