Download
1 / 52
520 likes | 607 Views
Understanding Lake Erie: Its History, Current State, and Its Future . Dr. Jeffrey M. Reutter Director, Ohio Sea Grant College Program. Jeffrey M. Reutter, Ph.D., Director. 1895—F.T. Stone Laboratory 1970—Center for Lake Erie Area Research (CLEAR) 1978—Ohio Sea Grant College Program

E N D
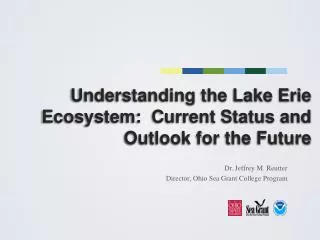
Understanding Lake Erie:Its History, Current State, and Its Future Dr. Jeffrey M. Reutter Director, Ohio Sea Grant College Program
Jeffrey M. Reutter, Ph.D., Director • 1895—F.T. Stone Laboratory • 1970—Center for Lake Erie Area Research (CLEAR) • 1978—Ohio Sea Grant College Program • 1992—Great Lakes Aquatic Ecosystem Research Consortium (GLAERC) • Grad student at Stone Lab in 1971 and never left. Director since 1987.
General Sea Grant • Part of National Sea Grant Collage Program in NOAA • 32 programs—every coastal state • Partnership of: • Government • Academia • Private Sector • Focus on 3 E’s: • Environment • Economy • Education • Accomplish through: • Research • Education • Outreach
What is Stone Lab? • Oldest freshwater field station in the nation • Ohio’s Lake Erie Lab since 1895 • OSU Island campus on Gibraltar Island, Lake Erie • Research, education, and outreach laboratory for Ohio Sea Grant
Sea Grant and Stone Lab • Research, education (k-gray), outreach to public • Based at OSU, but involve all Ohio colleges • Focusing Ohio’s universities on real-world problem solving • Stone Lab—25 college courses & credit workshops for private sector and agency managers (~250 students), 250 field trips & conferences, and with Lighthouse and AVC, we are visited by 20,000 people/yr • Website—10 million hits/yr • Leverage over $16/state BOR dollar invested in the program • 6-9 Extension specialists between Toledo and Conneaut • 2012 Media Coverage: 446 articles in 205 venues • January 2013 National Evaluation ranks us as one of the top programs in the country!!
Sea Grant & Stone Lab Improving Science Ed. • Education for all ages—6-7 days/week, 12-18 hour days • Kids fishing on AVC dock, age 3+ • Field trips grades 4-adult • Intro courses open to superior HS students • Upper level courses for juniors and seniors and grad students • Teacher courses • Workshops/conferences—managers, elected officials, professionals • Students • All are OSU students while at Stone Lab • Since 1990 from 112 universities and 366 high schools • Faculty • General Outreach • Aquatic Visitors Center and Lighthouse—12-17,000 visitors annually • Research • 60+ investigators annually
Sea Grant and Stone Lab: Since 1978 • 600+ Sea Grant Funded Projects • 600+ grad and undergrad students supported • ~300 principal investigators at over 20 colleges and universities • FOSL over 1400 scholarships at Stone Lab • 93 REUs (Research Experience for Undergraduates • 50+ research projects annually at Stone Lab
Aquatic Science Workshops • Grades 4 -adult; 1 or 2-day programs • 250+ groups and 8,000 people annually • Program includes • Science cruise • Bird/Plant/Insect interpretive hikes • Trawling and seining • Fish identification and Dissection • Plankton identification with microscopes
Opportunities to Visit Stone Lab • AVC: Wednesday through Saturday 10:00-5:00 • South Bass Island Lighthouse: Mondays and Tuesdays • Gibraltar Island • Wednesdays 11:00-1:00 • Thursday evening Guest Lecture Series (on Gib, in AVC, or live on Internet • Winter Program, Jan 2013 (Columbus) • Work Weekend, April • State Science Day, St. John’s Arena, May • Open House Saturday, Saturday in early September • Buckeye Island Hop, weekend in late September or early October
Sea Grant and Stone Lab Significant Accomplishments • Rebirth of Lake Erie in 70s—Dead Lake to Walleye Capital • 10 artificial reefs in Lake Ere near Cleveland • Economic development in Lorain • Preservation of Mentor Marsh and Mentor Lagoons • Ashtabula Harbor Cleanup • Lake Erie Water Snake no longer endangered • Detergent phosphorus ban • New phosphorus targets to prevent HABs • Controlling zebra mussels at water intakes • Better design of water intakes • Fishing regulations for smallmouth bass • Congressional Days, State Legislature Days, Coastal County Commissioner and Mayor Days, Science Writers, Charter Fishing Business Development and Education, Clean Marina Program • Lake Erie and Great Lakes Literacy Principles
Reducing Our Environmental Footprint • Solar thermal on Dining Hall • Solar panels on new pavilion • Low-flow toilets • Low-flow shower heads and faucets • Compact fluorescent light bulbs replace incandescent • Attic insulation
Southernmost Image: Ohio Sea Grant
Because of Land Use, Lake Erie Gets: More sediment More nutrients (fertilizers and sewage) More pesticides (The above 3 items are exacerbated by storms, which will be more frequent and severe due to climate change.) And Lake Erie is still biologically the most productive of the Great Lakes—And always will be!!
50:2 Rule (Not exact, but instructive) Lake Superior: 50% of the water and 2% of the fish Lake Erie: 2% of the water and 50% of the fish
80:10:10 Rule • 80% of water from upper lakes • 10% direct precipitation • 10% from Lake Erie tributaries • Maumee • Largest tributary to Great Lakes • Drains 4.5 million acres of ag land • 3% of flow into Lake Erie
Lake Erie’s 7 Biggest Problems/Issues (see Twine Line, Spring/Summer, 2012) • Sedimentation • Phosphorus and nutrient loading • Harmful algal blooms • Aquatic invasive species • Dead Zone • Climate Change—Makes the others worse • Coastal Economic Development
Lake Erie Stats Drinking water for 11 million people Over 20 power plants Power production is greatest water use 300 marinas in Ohio alone Walleye Capital of the World 40% of all Great Lakes charter boats Ohio’s charter boat industry is one of the largest in North America $1.5 billion sport fishery One of top 10 sport fishing locations in the world Most valuable freshwater commercial fishery in the world Coastal county tourism value is over $11.5 billion and 117,000 jobs
Lake Erie: One of the Most Important Lakes in the World Dead lake image of 60s and 70s. Poster child for pollution problems in this country. But, most heavily utilized of any of the Great Lakes. Shared by 5 states, a province, and 2 countries. Best example of ecosystem recovery in world.
Impact of Ecosystem Recovery (rebirth) Ohio walleye harvest 112,000 in 1976 to over 5 million by mid-80s 34 charter fishing businesses in 1975 to over 1200 by mid-80s and almost 800 today 207 coastal businesses to over 425 today
What brought about the rebirth (dead lake to Walleye Capital)? Phosphorus reductions from point sources (29,000 metric tons to 11,000);and agriculture helped!
Why did we target phosphorus? Normally limiting nutrient in freshwater systems P reduction is best strategy ecologically and economically Reducing both P and N would help
Algae are tiny plant-like organisms that live in water There are hundreds of species of algae in Lake Erie. Most are beneficial. • Source: Tom Bridgeman, UT
Major groups/kinds in Lake Erie Diatoms Greens Blue-greens (Cyanobacteria) • Source: Tom Bridgeman, UT
Impacts of Increased Phosphorus Concentrations • HABs—If P concentrations are high (regardless of the source, Ag, sewage, etc.) and water is warm, we will have a HAB (nitrogen concentration will likely determine which of the ~10 species bloom) • Nuisance Algae Blooms • Cladophora—Whole lake problem. An attached form. • Winter algal blooms • Dead Zone in Central Basin
Blue-green Algae Bloom circa 1971, Lake Erie Photo: Forsythe and Reutter
Microcystis, Stone Lab, 8/10/10 Photos: Jeff Reutter
Microcystin Concentrations 1 ppb WHO drinking water limit 20 ppb WHO swimming limit 60 ppb highest level for Lake Erie till 2011 84 ppb highest level for Grand Lake St. Marys till 2010 2000+ Grand Lake St. Marys 2010 1200 Lake Erie Maumee Bay area 2011
Reference Dose = amount that can be ingested orally by a person, above which a toxic effect may occur, on a milligram per kilogram body weight per day basis. Toxicity of Algal Toxins Relative to Other Toxic Compounds found in Water Toxin Reference Doses Dioxin (0.000001 mg/kg-d) Microcystin LR (0.000003 mg/kg-d) Saxitoxin(0.000005 mg/kg-d) PCBs (0.00002 mg/kg-d) Cylindrospermopsin (0.00003 mg/kg-d) Methylmercury(0.0001 mg/kg-d) Anatoxin-A (0.0005 mg/kg-d) DDT (0.0005 mg/kg-d) Selenium (0.005 mg/kg-d) Botulinum toxin A (0.001 mg/kg-d) Alachlor (0.01 mg/kg-d) Cyanide (0.02 mg/kg-d) Atrazine (0.04 mg/kg-d) Fluoride (0.06 mg/kg-d) Chlorine (0.1 mg/kg-d) Aluminum (1 mg/kg-d) Ethylene Glycol (2 mg/kg-d)
11 years of satellite data provide bloom extent high medium low Data from MERIS 2002-2011, MODIS 2012
Microcystis in Lake Erie • The Microcystis-Anabaenabloom of 2009 was the largest in recent years in our sampling region • …until 2011 Source: Tom Bridgeman, UT 2011
October 9, 2011 Photo: NOAA Satellite Image
Microcystis near Marblehead October 9, 2011 Photo: Richard Kraus, United States Geological Survey
HABs in 2013 • NOAA forecast in partnership with OSU Sea Grant and Stone Lab, Heidelberg U, and U of Toledo • Based on the total phosphorus load from the Maumee River 1 March to 30 June • Issued at Stone Lab press conference on 2 July
NOAA issued the first forecast in 2012. 2012 Forecast (mild bloom) and observed. Measured 2012 Forecast
2013 Forecast: Significant bloom.similar to 2003, much milder than 2011 2013
2013 prediction for western Lake Erie:similar to 2003, <1/5 of 2011, 2X 2012 2011 for comparison 2013 may resemble 2003 low medium high concentration
Lake Erie July 2, 2012Lake County Shoreline HAB Courtesy: Lake County General Health District
Target Loads to Solve Problem • Leading subcommittee of the Ohio Phosphorus Task Force to identify both spring and annual target loads of both total P and DRP to prevent or greatly reduce HABs • Target is 40% reduction
Nutrient Loading: Expect improvement • Scotts P removal from over the counter fertilizer bags • CSO’s moving in right direction (too slow?) • Detroit sewage—hopefully in compliance—but bankrupt • Frequency of severe storms continues to go up • Ag—expect improvement • Farm Bureau is supporting efforts to reduce P • Majority of farmers now accept responsibility • Certification programs being developed • 4R Program • Recommendations • Don’t apply more fertilizer than needed • Don’t apply on frozen or snow covered ground • Don’t broadcast, incorporate into soil • Don’t apply before when rain in immediate forecast