Download
1 / 45
450 likes | 614 Views
Understanding Lake Erie and Solutions to Its History of Nutrient Enrichment and HABs . Dr . Jeffrey M. Reutter Director, Ohio Sea Grant College Program. Jeffrey M. Reutter, Ph.D., Director. 1895—F.T. Stone Laboratory 1970—Center for Lake Erie Area Research (CLEAR)

E N D
Understanding Lake Erie and Solutions to Its History ofNutrient Enrichment and HABs Dr. Jeffrey M. Reutter Director, Ohio Sea Grant College Program
Jeffrey M. Reutter, Ph.D., Director • 1895—F.T. Stone Laboratory • 1970—Center for Lake Erie Area Research (CLEAR) • 1978—Ohio Sea Grant College Program • 1992—Great Lakes Aquatic Ecosystem Research Consortium (GLAERC) • Grad student at Stone Lab in 1971 and never left. Director since 1987.
Lake Erie Millennium Network (LEMN) http://www.uwindsor.ca/erie2001 Binational Network - formed November 1998 Convening Organizations: F.T. Stone Lab - Ohio State University (Jeff Reutter) NWRI - Environment Canada (Murray Charlton) Large Lakes Research lab - US EPA (Russ Kreis) GLIER - University of Windsor (Jan Ciborowski) Sponsors: Federal, State, Provincial, Regional organizations Collaborators: Groups active in research/information exchange
GLRRIN Coordination Team • Academic US – Jeff Reutter, Ohio State University Canadian – Jan Ciborowski, University of Windsor • Agency US – Paul Horvatin, US EPA, Great Lakes National Program Office Canadian – John Lawrence, Environment Canada Mark Burrows—IJC, GLRRIN Secretary
Coordinated Research Supported by GLNPO & LEC LAKE ERIE NUTRIENT LOADING AND HARMFUL ALGAL BLOOMS: Research Findings andManagement Implications Final Report of the Lake Erie Millennium Network Synthesis Team Ohio Sea Grant College Program The Ohio State University Technical Summary Number: OHSU‐TS‐060 14 June 2011
Principal Investigators Jeffrey M. Reutter, The Ohio State University Jan Ciborowski, University of Windsor Joseph DePinto, LimnoTech, Inc. Darren Bade, Kent State University David Baker, Heidelberg University Thomas B. Bridgeman, University of Toledo David A. Culver, The Ohio State University Steve Davis, Natural Resources Conservation Service Elizabeth Dayton, The Ohio State University Douglas Kane, Defiance College Robert W. Mullen, The Ohio State University Christopher M. Pennuto, Buffalo State College
Lake Erie: One of the Most Important Lakes in the World Dead lake image of 60s and 70s. Poster child for pollution problems in this country. But, most heavily utilized of any of the Great Lakes. Shared by 4 states, a province, and 2 countries. Best example of ecosystem recovery in world.
Lake Erie Stats Drinking water for 11 million people Over 20 power plants Power production is greatest water use 300 marinas in Ohio alone Walleye Capital of the World 40% of all Great Lakes charter boats Ohio’s charter boat industry is one of the largest in North America $1.5 billion sport fishery One of top 10 sport fishing locations in the world Most valuable freshwater commercial fishery in the world Coastal county tourism value is over $11.5 billion and 119,000 jobs
Southernmost Image: Ohio Sea Grant
Because of Land Use, Lake Erie Gets: More sediment More nutrients (fertilizers and sewage) More pesticides (The above 3 items are exacerbated by storms, which will be more frequent and severe due to climate change.) And Lake Erie is still biologically the most productive of the Great Lakes—And always will be!!
Lake Erie’s 7 Biggest Problems/Issues (see Twine Line, Spring/Summer, 2012) Sedimentation Phosphorus and nutrient loading Harmful algal blooms Aquatic invasive species Dead Zone Climate Change—Makes the others worse Coastal Economic Development
50:2 Rule (Not exact, but instructive) Lake Superior: 50% of the water and 2% of the fish Lake Erie: 2% of the water and 50% of the fish
80:10:10 Rule • 80% of water from upper lakes • 10% direct precipitation • 10% from Lake Erie tributaries • Maumee • Largest tributary to Great Lakes • Drains 4.5 million acres of ag land • 3% of flow into Lake Erie
Lake Erie Poster child for pollution problems when Cuyahoga River burns in 1969 To “walleye capital of the world” in mid-1980s Best example of ecosystem recover in world
What brought about the rebirth (dead lake to Walleye Capital)? Phosphorus reductions from point sources (29,000 metric tons to 11,000);and agriculture helped!
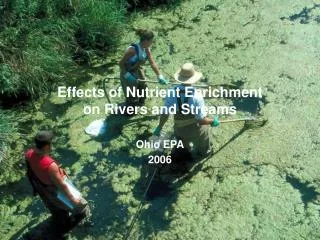
Impacts of Increased Phosphorus Concentrations • HABs—If P concentrations are high (regardless of the source, Ag, sewage, etc.) and water is warm, we will have a HAB (nitrogen concentration will likely determine which of the 6-7 species bloom) • Nuisance Algae Blooms • Cladophora—Whole lake problem. An attached form. • Dead Zone in Central Basin
Blue-green Algae Bloom circa 1971, Lake Erie Photo: Forsythe and Reutter
Microcystis, Stone Lab, 8/10/10 Photos: Jeff Reutter
Impact of Ecosystem Recovery (rebirth) Ohio walleye harvest 112,000 in 1976 to over 5 million by mid-80s 34 charter fishing businesses in 1975 to over 1200 by mid-80s and almost 800 today 207 coastal businesses to over 425 today
Phosphorus Sources • 1960s and 70s—primarily point sources (2/3) • Today loading is coming primarily from agriculture (2/3) but other sources include: • Sewage treatment plants and CSOs • Lawn fertilizer runoff • Water treatment plants • Septic tanks
Microcystin Concentrations 1 ppb WHO drinking water limit 20 ppb WHO swimming limit 60 ppb highest level for Lake Erie till 2011 84 ppb highest level for Grand Lake St. Marys till 2010 2000+ Grand Lake St. Marys 2010 1200 Lake Erie Maumee Bay area 2011
Nutrient Loading Majority of loading occurs during storm events 80-90% of loading occurs 10-20% of time 2012 = dry spring and low load—a very good thing!!
Microcystis in Lake Erie • The Microcystis-Anabaenabloom of 2009 was the largest in recent years in our sampling region • …until 2011 Source: Tom Bridgeman, UT 2011
October 9, 2011 Photo: NOAA Satellite Image
Microcystis near Marblehead October 9, 2011 Photo: Richard Kraus, United States Geological Survey
Climate change is making these problems worse! • Warm water favors HABs • Warm water increases oxygen depletion rates • More severe storms will resuspend more sediment and increase erosion and nutrient loading • Critically important point—with no changes in Ag practices, warmer weather and increased frequency of severe storms could increase negative impact of existing practices. • Lake levels—uncertain/probably down
NOAA HAB Forecast--2012 • Loading from March through June is critical point • Drought leads to low rainfall and runoff • Heidelberg data shows loads lowest in 40 years • UT data show Maumee Bay concentrations less than 1/10 of 2011 • Therefore, 2012 bloom will be less than 10% of 2011 bloom in Western Basin and similar to 2007.
Microcystis in Lake Erie Source: Tom Bridgeman, UT Justin Chaffin, Ohio Sea Grant and Stone Lab
Target Loads to Solve Problem Leading subcommittee of the Ohio Phosphorus Task Force to identify both spring and annual target loads of both total P and DRP to prevent or greatly reduce HABs Target is 40% reduction
Nutrient Loading • Even if spring 2013 is very wet the bloom shouldn’t be as bad as 2011 • Expect improvement • P removal from over the counter fertilizer bags • CSO’s moving in right direction (too slow?) • Detroit sewage—hopefully in compliance • Frequency of severe storms continues to go up • Ag—expect improvement • Farm Bureau is supporting efforts to reduce P • Majority of farmers now accept responsibility • Certification programs being developed • 4R Program
Ag Solutions Don’t apply more than you need for crops (follow tri-state recommendations) Don’t broadcast—incorporate into soil Don’t apply on frozen ground Don’t apply before rain event
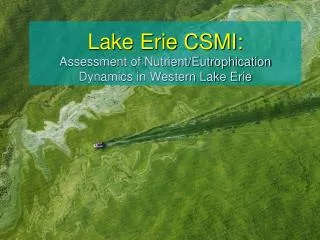
Collaborative Monitoring Program • Goal: • Take advantage of strength of each program • Better coverage of Lake Erie • Minimize cost • Synchronize sampling dates • Develop uniform sampling procedures • Identify central data repository • Synthesize results to tell a uniform story
Collaborators • Heidelberg—tributary monitoring--continuous • Univ. Toledo—Maumee Bay—bi-weekly • OEPA—Nearshore Toledo to Conneaut—biweekly or monthly • Sea Grant/Stone Lab—open water West Sister to Huron bi-weekly and event-based; central basin events with trailered boat; event and place-based with NOAA satellite guidance • Charter captains—bi-weekly and event-based
Sampling methods pros and cons Fishing Charter Boats Univ Toledo USGS Ann Arbor OSU Stone Lab USGS Sandusky ODNR OEPA Nearshore Pros: “photic zone” Cons: Samples differ among sites. Composition point differs among phytoplankton. Dependent on sunlight. Turbid waters result in a shallow sample. Pros: Easy Cons: Over estimates surface scum compared to water column. Pros: Represents most of the water column. Easier than tube sampler. Cons: Misses surface scum. Need equal volumes of each sample Pros: Best represents entire water column. Cons: Bulky samplers in deep water. Scums diluted. LAKE BOTTOM OR THERMOCLINE
Water Quality Analyzes Fishing Charter Boats Univ Toledo USGS Ann Arbor OSU Stone Lab USGS Sandusky ODNR OEPA Nearshore TP, Chlorophyll a DRP (SRP), TDP, Nitrate, Nitrite, Urea, TDN, Ammonium, Total Kjeldahl N, Silicate, Total SS, NVSS, Microcystin, Phytoplankton, Microcystis biovolume TP, Chlorophyll a* DRP (SRP), Nitrate, Microcystin, Phytoplankton TP, Chlorophyll a* Phytoplankton TP, Chlorophyll a* DRP (SRP), Nitrate, Microcystin, Phytoplankton *Different analysis methods LAKE BOTTOM OR THERMOCLINE
AIS: Zebra/Quagga Mussels & Round Gobies Photo: Ohio Sea Grant
Because Lake Erie is the southernmost, shallowest, warmest, and most nutrient-enriched of the Great Lakes, it is likely that AIS will always present the greatest problem, and have the greatest impact, in Lake Erie.
Contact information:Dr. Jeff Reutter, Director Ohio Sea Grant and Stone Lab Ohio State Univ. 1314 Kinnear Rd. Col, OH 43212 614-292-8949 Reutter.1@osu.edu ohioseagrant.osu.edu Stone Laboratory Ohio State Univ. Box 119 Put-in-Bay, OH 43456 614-247-6500