School Climate and the CCRPI
630 likes | 1.33k Views
School Climate and the CCRPI. Marilyn Watson Program Manager, Safe and Drug-Free Schools. Jeff Hodges Program Specialist, Safe and Drug-Free Schools. Agenda. The impact of school climate What is school climate? How do we measure school climate?

School Climate and the CCRPI
E N D
Presentation Transcript
School Climate and the CCRPI Marilyn Watson Program Manager, Safe and Drug-Free Schools Jeff Hodges Program Specialist, Safe and Drug-Free Schools
Agenda The impact of school climate What is school climate? How do we measure school climate? What factors impact the development of school climate? How does school climate impact academic success and student behavior? School climate and the CCRPI GaDOE Resources
Research has demonstrated that a positive school climateis associated with: • Academic achievement • Student engagement in school • Positive social skills development Studies show that there is a significant difference in student achievement between schools with a good school climate and those with a poor school climate.
We can all remember childhood moments when we felt particularly safe (or unsafe) in school. • We can all remember when we felt particularly connected to a caring adult (or frighteningly alone) in school. • We can all remember when we felt particularly engaged in meaningful learning (or not).
The Impact of School Climate The systematic study of school climate has led to a growing body of research that attests to its importance in a variety of overlapping ways, including social, emotional, intellectual and physical safety development; mental health, and healthy relationships.
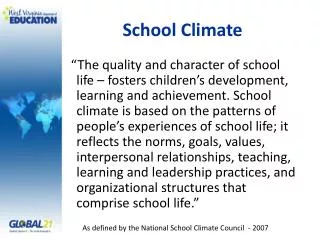
What is School Climate? “School Climate refers to the quality and character of school life. School Climate is based on patterns of students’, parents’, and school personnel’s experience of school life and reflects norms, goals, values, interpersonal interactions, teaching and learning practices and organizational structures.” -National School Climate Center
School Climate vs. School Culture • Climate and Culture are often used interchangeably. • Climate emphasizes shared perceptions of those within the organization • Culture focuses on shared assumptions, shared meanings, and shared beliefs • Climate measures are based on student, teacher, and administrator perceptions or personal experiences. • Culture measures are based on the rooted organizational values. • Climate is the measure and culture is the change agent.
School Climate Includes: • Norms, values, and expectations that support people feeling socially, emotionally and physically safe. • People are engaged and respected. • Students, families and educators work together to develop, live, and contribute to a shared school vision. • Educators model and nurture attitudes that emphasize the benefits and satisfaction gained from learning. • Each person contributes to the operations of the school as well as the care of the physical environment.
What Does That Mean? Students: If students do not feel safe at school, do not feel welcomed at school, are not treated with respect, and are not given opportunities to learn, mature and grow, they will not meet their academic potential or learn positive social lessons. Schools: If the school climate is not positive, students will underperform, student attendance and student discipline are not likely to improve, school safety could be compromised, and teacher retention may be negatively affected.
Four Dimensions of School Climate Safety:referring to the physical and emotional safety of students and the rules and procedures in place to ensure student safety; Relationships:student social support from educators and parents, the level of respect students have for others, school and community engaged, and student and parental leadership; Teaching and Learning:a positive and professional student-teacher-school relationship, social and emotional skills training, civic education, and positive support for learning; and Institutional Environment: the physical environment of the school. Source: National School Climate Center
The Georgia Department of Education (GaDOE) is one of the first states with a defined method in the collection and analysis of school climate data through the implementation of a statewide annual survey: Georgia Student Health Survey II (GSHS II). The GSHS IIis an anonymous, statewide survey instrument developed by the GaDOE in collaboration with the Georgia Department of Public Health and Georgia State University. The GSHS IIidentifies safety and health issues that can have a negative impact on student achievement and school climate.
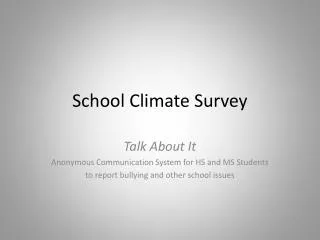
Measuring School Climate in Georgia • Georgia Student Health Survey II (GSHS II) • Administered annually to all students in grades 6-12. • Covers various topics such as school climate and safety, alcohol and drug use, bullying, suicide and self-harm, nutrition, sedentary behaviors, and teen driving laws. • Georgia School Personnel Survey (GSPS) • Administered annually to teachers, staff and administrators. • Developed to accompany the GSHS II. • Parent Survey • Fall 2013 • School Climate Star Rating • Part of Georgia’s new accountability system – College and Career Ready Performance Index (CCRPI)
GSHS II – Macro School Climate Collaborative project with The Center for School Safety, School Climate and Classroom Managementat Georgia State University • Examined all questions on the GSHS II • Conducted Factor Analysis to look at clustering of items which measure the same construct • Statistically linked eleven (11) questions to the direct measurement of macro school climate • Other survey questions are important to identifying micro school climate
GSHS II – Macro School Climate Identified Questions Assessing School Climate: School Climate #1: “I Like School” School Climate #2: “I Feel Successful at School” School Climate #3: “I feel my school has high standards for achievement” School Climate #4: “My School Sets Clear Rules for Behavior” School Climate #5: “I know what to do if there is an emergency at my school” School Climate #6: “Teachers treat me with respect” School Climate #7: “The behaviors in the classroom allow the teacher to teach so I can learn” School Climate #8: “Students are frequently recognized for their good behavior” School Climate #9: “I feel my school counselor would be helpful if I needed assistance” School Climate #10: “I get along with other students and adults” ** School Climate #11: “School is a place at which I feel safe” **
Connecting GSHS II with the FourDimensions of School Climate DimensionsGSHS II Questions • School Climate #4: “My School Sets Clear Rules or Behavior” • School Climate #5: “I know what to do if there is an emergency at my school” • School Climate #11: “School is a place at which I feel safe” • School Climate #3: “I feel my school has high standards for achievement” • School Climate #8: “Students are frequently recognized for their good behavior” • N/A • School Climate #6: “Teachers treat me with respect” • School Climate #7: “and School Climate #10: • School Climate #1: “ I Like School”; School Climate #2: “I Feel Successful at School” • School Climate #9: “I feel my school counselor would be helpful if I needed assistance”
Determinates of School Climate • Analyzed the impact of student demographics and environmental factors on the development of school climate • Used school-level data from 2008-2012 to isolate factors associated with school climate development Results • No specific student demographics impacted the development of school climate • Level of socioeconomic status did not predetermine the ability to develop school climate • Teacher and administrator experience did not impact the ability to develop school climate • Local type (i.e. Urban, Suburban, or Rural) did not impact the ability to develop school climate
Summary of Results: Factors Impacting School Climate • Student nor teacher demographics appear to significantly impact school climate development. • Results indicate school climate is a product of intrinsic motivation and personal actions of teacher and leaders. • Results lay foundation for analyses connecting school climate to academic and student behavioral outcomes.
School Climate & Academic Outcomes School Level Analysis
Academic Impact of School Climate • Analyzed the impact of changes in school climate on CRCT and End of Course Test performance • Used school-level data from 2008-2012 Results • Significant impact on mathematics performance • 3x as large as any other subject • 1% increase in school climate increased scale scores between 3% and 16% • Teacher and administrator experience did not impact the development of school climate • Local type (i.e. Urban, Suburban, or Rural) did not impact school climate
Summary of Results: School Climate and Academic Outcomes • School Climate has a significant impact on a school’s passing percentage • Most significant impact on mathematics performance • Gains in school climate are associated with positive gains for all subject areas • Effect constant across both middle and high schools
School Climate & Behavioral Outcomes School Level Analysis
Behavioral Impact of School Climate • Analyzed the impact of changes in school climate on student attendance, disciplinary incidents, and suspension days • Used school-level data from 2008-2012 Results • 1% increase in school climate leads to 1.34% decrease in the number of disciplinary incidents • 1% increase in school climate leads to 0.89% decrease in suspension days per FTE • 1% increase in school climate increases student attendance rate by 1.6%
Summary of Results: School Climate and Behavioral Outcomes • School Climate significantly impacts student behavioral outcomes • 1% increase in School Climate is estimated to decrease discipline actions per pupil by 1.35% • School Climate increases student attendance • 1% increase in School Climate is estimated to increases average daily attendance by 1.60% • School Climate decreases suspension days per pupil • Effect constant across both middle and high schools
What does this mean? School Climate and the CCRPI
The College and Career Ready Performance Index (CCRPI) • ESEA Flexibility under NCLB • CCRPI is Georgia’s new accountability system replacing AYP • Incentivizes student performance across a number of academic and behavioral areas. • Student attendance, student discipline, school climate, and substance abuse/violent incidents will be included within the reporting document.
School Climate Star Rating 1-5 (poor to excellent)
School Climate Star Rating Components:School Climate • Student Responses – Georgia Student Health Survey II • 75% Participation Required for each grade level (6 -12) • Personnel Responses – Georgia School Personnel Survey • 75% of Teachers/Administrators Required • Survey administered in May 2013 for 2012-13 school year • 75% Participation requirement begins in 2013-14 • Parent Responses – Parent Survey (new for 2013-14) • No participation requirement for parents • School-wide Agreement • Variance between composite answers of students, teachers, and parents
School Climate Star Rating Components: Student Discipline • Weighted Suspension Rate • Maximum value for each student – each student counted once • Suspension Weights: • Any # of ISS: 0.50 pts. • 1 – 2 OSS: 1.00 pts. • 3 – 4 OSS: 3.00 pts. • 5 or more OSS: 5.00 pts. • Alternative School Assignment 6.00 pts. (for disciplinary reasons only) • Expulsion 7.00 pts. • Scores will be on a 0 – 100 scale • Schools receiving a negative student discipline output will be recoded to 0. • Impact Data: Statewide Average is 81.52
School Climate Star Rating Components: Safe and Substance-Free Learning Environment • % of discipline incidents that are not violent incidents using student discipline data • % of discipline incidents that are not drug/alcohol related incidents using student discipline data using student discipline data • % of students not abusing substances (i.e. illegal drugs, prescription drugs, alcohol, etc.) using GSHS II data • % of students not experiencing bullying or harassment using GSHS II data • Scores will be on a 0 – 100 scale • Schools receiving a negative student discipline output will be recoded to 0. • Impact Data: Statewide Average is 95.23
School Climate Star Rating Components: School Attendance • Average Daily Attendance Rate of Students • All students will be included • Average Daily Attendance Rate of Teachers • Includes those who have a job code designated as a teacher • Removes individuals who have more than 45 days of total leave • Average Daily Attendance Rate of Administrators • Includes those who have a job code designated as an administrator • Removes individuals who have more than 45 days of total leave • Average Daily Attendance Rate of Staff • Includes those who have a job code designated as staff • Removes individuals who have more than 45 days of total leave
Additional Considerations • USCO • “Persistently Dangerous Schools” will receive negative points on School Climate Star Rating • Disciplinary Disproportionality • Program Services examines the risk of being suspended between Students with Disabilities (SWD), English Language Learner (ELL), and Economically Disadvantaged compared to their non-service reference group. • Race/Ethnicity examines the risk each subgroup compared to all other students. • Group size = 15 // Incident size = 5 • Disproportionate at 5x the risk for subgroup • Risk will decrease 0.25 per year until it reaches 3x where it will remain • Need two (2) consecutive years per subgroup for disproportionality “penalty” • Suspension risk includes: OSS, Expulsion, and Assignment to Alternative Schools • Positive Behavioral Interventions and Supports (PBIS) Programs • Fidelity of implementation surrounding RTI, PBIS, and other SAMHSA approved programs
So what can be done? Resources and Supports
GaDOE Resources • School Safety Assessment • Comprehensive, on-site review of the school facility, policies and procedures to assess the total school environment. • Positive Behavioral Supports and Interventions (PBIS) • An effective proactive and data-driven school-wide system promoting positive behavior, with a focus on prevention of inappropriate behaviors. • Defines a set of universal behavior, the use of a common language, and positive staff-to-student interactions. • School Safety Hotline • Toll-free and anonymous hotline designed for crisis prevention.
GaDOE Online Resources Bullying Prevention Toolkit School Attendance Toolkit Human Trafficking Prevention/Intervention Toolkit School Safety Resources Child Abuse Prevention Resources www.gadoe.org
QUESTIONS?? Marilyn Watson: mawatson@doe.k12.ga.us Jeff Hodges: jhodges@doe.k12.ga.us