Download
1 / 67
720 likes | 960 Views
Analytical perspectives: causes of deforestation . Sources and causes Agents and motivations Market failures Efficiency markets ownership Natural resource abundance open access Property rights not well defined predatory competition Externalities ecological functions

E N D
Analytical perspectives: causes of deforestation • Sources and causes • Agents and motivations • Market failures • Efficiency markets ownership • Natural resource abundance open access • Property rights not well defined predatory competition • Externalities ecological functions • Institutional failures • Lack of government institutions • High costs of monitoring and fiscalization
Environmental functions (services) of tropical forests • Global climate stability carbon sequestration greenhouse effect (GWP intact forest nearly balanced) • Preservation of biodiversity scientific and aesthetic benefits (global) • Regional climate stability (~national) • Hydrological balance and watershed protection (local) • Recycling of soil nutrients (local) • Protection against fire susceptibility (local)
Scanty evidences on Brazilian biodiversity • Global estimates 13 m (3 to 100) species of which 1.5 m catalogued • Brazil share is 10 to 20% or 150 a 300 thousand (megadiversity) • 20% of world vegetation • 10% of vertebrate animals • 15 to 30 thousand catalogued • 1% scientifically prospected
Amazon Deforestation and Carbon Dioxide Emissions, 1978-2003
Net carbon emissions from land use changes in Brazilian biomes, 1988-94 (MCT 2004)
North Region: Secular growth performance, 1840-2000 Stabilization 1994 Macro crisis and stagnation 1980-2000 Regional policies 1960-80 Rubber boom Rubber Demographic and 1840-1912 crisis economic lethargy 1912-1960
Drivers of deforestation in Brazilian Amazon • Macroeconomic factors: growth and exports • Accessibility to markets (transport cost) and geo-ecological conditions (topology and rainfall) are crucial determinants of profitability and deforestation • Agricultural research (Embrapa) soybean • Profits derived from productive activities -- logging, cattle ranching and commercial crops (soybean) -- drives deforestation; • Government incentives and subsidies were important in the 70s not anymore; but federal transfers still make a significant contribution to urban income • Land price speculation play a temporary role in remote areas with costly access to markets;
Amazon deforestation x growth of Brazilian GDP (1988-2005)Def = 775*%GDP + 16.600 km2
Regional differences in real land prices: cleared areas, 1966-2002
Reduction in transport cost to national markets (São Paulo), 1968-80
Reduction in transport cost to national markets (São Paulo), 1980-95
Reduction in transport cost to local markets (State capital), 1968-80
Reduction in transport cost to local markets (State capital), 1980-95
Costs and benefits: roads(Fuller et al 2002, McVey 2002) • Soybean trucked to markets (~ 800 miles) in very poor road conditions 2 x US costs • Paving of roads is a hot policy issue (Avança Brasil) • Mechanical extrpaolations Laurance et. al 2002 catastrophic results; 35-50% of Amazonia deforested • Econometric models Andersen et al. 2002 Pfaff et al. 2005 more reasonable impacts • Roads lead to land use intensification (logging and cattle rising) deforestation impact depends on the elasticity of demand in relevant markets (Angelsen 1999): local x national markets
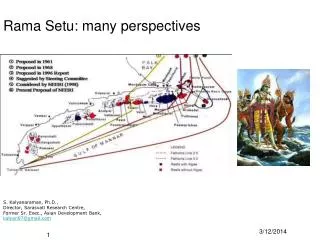
The Carajás investment program: the railway corridor (EFC), steel mills (+) and the impact area (AIC)
Trends and projections • Geometric trend extrapolations of deforestation are untenable. Land prices and land use intensification (short fallow) act as deterrents of deforestation. Systemic effects are important • The indirect long run effects of Carajás on deforestation are relatively small. Urban concentration of population increases land prices and reduces fertility rates • Policy trade-offs: deforestation x growth favors subsidized credit credit; deforestation x equity favor roads; land prices are crucial
Policy issues: impacts of Carajás • Demographic transition and urbanization smaller long run rates of population growth • Population density higher price of land intensification of land use saturation effects • Roads increased commercialization intensification of land use
Soybean yield in AML and the rest of Brazil, 1975-2004 (ton/ha)
Spatial dynamics of deforestation in Amazon • Squatter doing shifting cultivation and loggers are leading agents of (small scale) deforestation in wild areas • Cattle ranchers and large scale deforestation come in the second stage of frontier settlement • Commercial crops (soybean) penetrate in the third stage replacing pasture area with relatively small impact on deforestation in consolidated areas
Cost and benefits: cattle raising (Margulis 2002, Faminow 1999, Andersen 2002) • Early settlers capitalize gains in land appropriation (land price speculation) • Large (capitalized) cattle ranchers appropriate most of the gains of forest conversion: • rates of return in cattle ranching are potentially high (circa 10% p.a.) • Deforestation + small scale cattle ranching important mechanism of social mobility extensive land use technologies • No ecological/precipitation constraint penetrates the rain forest • Economic/environmental sustainability of cattle ranching still an open issue
Cost and benefit: soybean (Ong 2004, Rezende 2004) • The role of Embrapa agricultural research was crucial specially for soybean cultivation • Large scale mechanized technology leads to income concentration but does not generate frontier proletarians • Agro-business activities urban employment • Strong precipitation restrictions does not penetrate the dense rain forest • Comes in a later stage of settlement mechanization requires no trunks and roots
Technology and deforestation (Angelsen and Kaimowitz 2001) • Sustainable development requires both higher productivity and forest conservation • Technological change (progress) • Increase in TFP (total factor productivity) • Embodied (in inputs) x disembodied (management) • Factor saving x neutral changes • Technological change x deforestation • Green revolution (Borlaug) hypothesis: fixed demand + higher yield less agricultural area (global level) • Subsistence hypothesis: new technology impact on land requirements • Full belly x increased aspirations) • Land degradation hypothesis • Development hypothesis: dynamic feed backs are positive (EKC, forest transition, Nerlove)
Technology and deforestation • Selective logging is important source of finance for initial investment • Slash and burn technique is a rational response to the relative scarcity of labor and capital in the early stages of settlement • Cattle raising with extensive land use is a rational product/technology choice given the low prices of land and thus becomes the most important source of deforestation • Intensification requires adequate infrastructure (roads) and adequate topology • Geo-ecological (rainfall) barries to commercial crops (soybean as suplementary feeding)
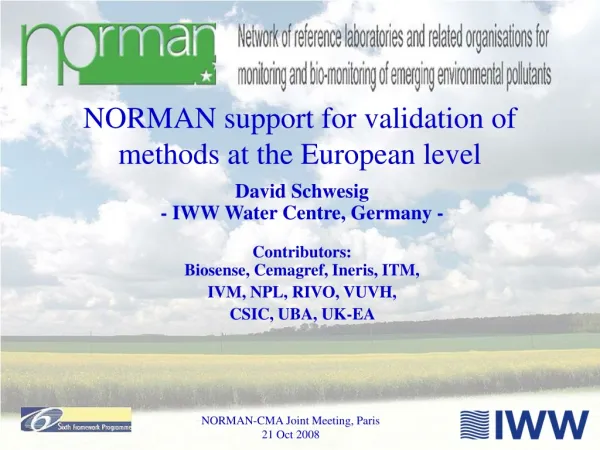
Above-ground carbon cycle in-slash-and-burn agriculture initial carbon stock Carbon stock in Vegetation (ton / ha) 1st burn abandon decomposition + use secondary recovery Time