Download
1 / 31
310 likes | 479 Views
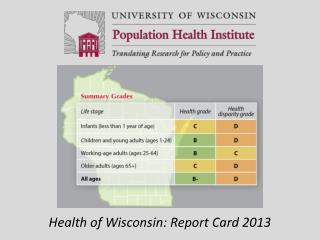
Health of Wisconsin: Report Card 2013. Grading Health. Wisconsin’s grade for health is based on two ways of measuring health: 1) length of life and 2) quality of life

E N D
Grading Health Wisconsin’s grade for health is based on two ways of measuring health: 1) length of life and 2) quality of life We measure length of life by examining death rates. We examined death rates for four distinct age groups: infants (less than 1 year old), children and young adults (ages 1-24), working-age adults (ages 25-64), and older adults (ages 65 and over). We measure quality of life by measuring self-reported unhealthy days for working-age and older adults. We report the mean (average) number of unhealthy days reported per month. The numbers are based on adult (age 25+) respondents’ answers to two questions about their health in the past month: 1) how many days was your physical health poor? 2) how many days was your mental health poor?
Grading Health Disparities In order to present a complete picture of health in Wisconsin, we developed a health disparity grade based on the health of different groups of people. To do this, we examined the health of subgroups of the population within each life stage based on four characteristics: Gender Geography Socioeconomic Status Race/Ethnicity To measure the disparity among subgroups, we compared the health grade of each Wisconsin subgroup to the grade of the healthiest subgroup of the same age in Wisconsin.
Health Grade ChangesSince 2010 • The overall health grade for the state of Wisconsin has remained a B-. • The health disparity grade has worsened from a C- to a D indicating that Wisconsin needs to be doing more to reduce health disparities within the state.
Funding for this project was provided by Wisconsin Partnership Program, UW School of Medicine and Public Health
Contact InformationUniversity of Wisconsin Population Health InstituteDepartment of Population Health SciencesUniversity of Wisconsin School of Medicine and Public Health575 WARF Building610 Walnut StreetMadison, WI 53726-2397http://uwphi.pophealth.wisc.edu