Download
1 / 29
290 likes | 431 Views
Indirect estimation of burden in TB epidemiology. Chris Dye, coordinator of STB/TME. 5 targets for global TB control MILLENNIUM DEVELOPMENT GOALS "to have halted and begun to reverse incidence..". Implementation (DOTS) Indicator 24 (target year 2005) Case detection 70% (> 6 m diagnosed)

E N D
Indirect estimation of burden in TB epidemiology Chris Dye, coordinator of STB/TME
5 targets for global TB controlMILLENNIUM DEVELOPMENT GOALS"to have halted and begun to reverse incidence.." Implementation (DOTS) Indicator 24 (target year 2005) Case detection 70% (> 6 m diagnosed) Treatment success 85% (> 5 m cured DOTS) Impact Indicator 23 (target year 2015 cf 1990) Prevalence 50% of ≈ 300/100K Deaths 50% of ≈ 30/100K (< 1m deaths)
MEASURING PROGRESS TOWARDS MDGs • For all forms of TB • Incidence rate: per 100,000 per year • Prevalence rate: per 100,000 • Death rate: per 100,000 per year For sputum smear+ TB
TREATMENT SUCCESS • From DOTS cohorts • records of patients observed on treatment • cure + completion • completion ambiguous where drug resistance frequent • fate of patients lost to follow-up is unknown (defaulted, transferred, diagnosed but not registered, registered but not evaluated) • verification of national reports needed (bias from incentives to meet targets?)
CASE DETECTION • From direct estimates • simple inventory methods; indicators related to case detection (e.g. proportion smear+) from abundant surveillance data • mark-recapture may need special studies • From indirect estimates (notifications/ estimated incidence) • requires estimates of incidence…
Completeness of case and death registrations: comparison of data sources in Japan • 6% of cases treated under insurance schemes were not registered • 2-20% (3 to 29 of 157) of TB deaths were not reported as cases while alive Conclusion: New TB cases are 6-20% under-reported
Mark-recapture methodPetersen 1896Lincoln 1930 (ducks) Take 2 independent samples from an unknown population of N TB patients:
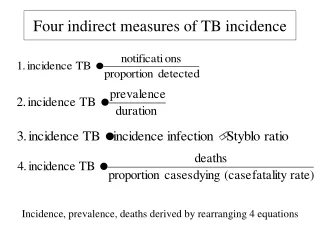
Four indirect measures of TB incidence Incidence, prevalence, deaths derived by rearranging 4 equations
INCIDENCE 1 • From case notifications • direct measure if CDR high; all countries have a TB notification system; ultimate goal of M&E • case detection often low • From tuberculin surveys (and Styblo rule) • cheap and logistically uncomplicated; 1o measure of transmission • TST often ambiguous (low transmission, BCG); Styblo 1:50 rule no longer applies (treatment, unstable TB, HIV); measures infection over past 10y
Bucking the trend: Netherlands and USA 14 12 10 8 Case notification rate/100K/yr 6 4 USA 2 Netherlands 0 1980 1983 1986 1989 1992 1995 1998 2001
Styblo ratio: 1% ARI to 50 ss+/100,000 population (range 40-60) • Accuracy of ARI from tuberculin surveys (e.g. with high BCG coverage)? • 1:50 breaks down when TB incidence not stable (gets bigger in decline), and in presence of HIV
INCIDENCE 2 • From consecutive prevalence surveys • potentially accurate, direct measure (if precise and unbiased) • costly, logistically complex, ≥2 surveys at right interval, individual follow-up (research tool) • From a single prevalence survey (I = P/d) • just one survey needed • needs accurate estimate of duration
Prevalence versus incidence: Korean civil servantsTubercle and Lung Disease 76, 534 (1995) • Prevalence PTB 1990 241/100K • Incidence PTB 1989-90 84/100K/yr • Estimated duration = 241/84 = 2.9 years (bigger ratio for older age groups)
Incidence and prevalence by age: Incidence and prevalence by age: Incidence and prevalence by age: Incidence and prevalence by age: Korea Korea Korea Korea 900 900 900 900 18 18 18 18 Prevalence Prevalence Prevalence Prevalence 800 800 800 800 16 16 16 16 700 700 700 700 Incidence Incidence Incidence Incidence 14 14 14 14 600 600 600 600 12 12 12 12 Prevalence/ Prevalence/ Prevalence/ Prevalence/ 500 500 500 500 10 10 10 10 Incidence Incidence Incidence Incidence Rates/100,000 Rates/100,000 Rates/100,000 Rates/100,000 Prevalence/incidence Prevalence/incidence Prevalence/incidence Prevalence/incidence 400 400 400 400 8 8 8 8 300 300 300 300 6 6 6 6 200 200 200 200 4 4 4 4 100 100 100 100 2 2 2 2 0 0 0 0 0 0 0 0 20-29 20-29 20-29 20-29 30-39 30-39 30-39 30-39 40-49 40-49 40-49 40-49 50-59 50-59 50-59 50-59 60-69 60-69 60-69 60-69
Disease prevalence from population surveys e.g. Philippines, China, Cambodia • Duration: time span of the condition measured in prevalence survey e.g. ss+ disease • Duration from e.g. patients and physicians asked about reporting and treatment delays (often underestimated)
Accuracy of deaths from vital registration or verbal autopsy? • Case fatality more accurately measured from observed cohorts (but fate of defaulters, transfers?) • CFR less accurately from unseen patients, whether treated or untreated
TB incidence weakly related to social and economic variables: infant mortality 6.5 6.0 5.5 AF AS 5.0 CA 4.5 EE Ln (estimated TB incidence) SA 4.0 US WP 3.5 ME 3.0 WE Series10 2.5 2.0 1.5 1.5 2.0 2.5 3.0 3.5 4.0 4.5 5.0 5.5 Ln (Infant mortality rate 1991)
Association between the rate of TB among country-of-birth-specific groups in Australia and the rate of TB in the country of birth. From Watkins & Plant 2003.
PREVALENCE • From population-based surveys • accurate measure of bac+ disease • changes quickly in response to control • measures quality of surveillance • platform for related investigations on patients and health system • costly • does not accurately identify bac- • logistically complex - not annually, not many countries • large sample sizes needed • does not easily yield estimate of incidence
What is “burden”? • DALY = YLL (death) + YLD (disability) • For TB ~ 90% DALYs due to death • death is why TB is among top 10 in “burden” league table
MORTALITY 1 • From patient cohorts • direct, observation of number dying • deaths in cohort only, not in population at large and not beyond period of follow-up; deaths among e.g. defaulters unknown; deaths during treatment not always due to TB • From incidence × case fatality (CFR) • simple and widely applicable • needs accurate estimates of incidence and CFR; CFR poorly known outside observed cohorts; death surveys require large samples
MORTALITY 2 • From vital registration • direct measure of TB deaths and trends; can be reported annually • VR does not exist in many high-burden countries; where it exists, accuracy usually unknown • From verbal autopsy • review of registered deaths can improve accuracy of cause of death statistics • sensitivity and specificity of VA not fully evaluated; surveys of TB deaths require large samples
Cause of death based on VSD and VA of 48 000 adult (> 25) deaths in Chennai, India: 1995-97
SUMMARY • Surveillance is the ultimate tool for M&E (measuring incidence, treatment success, mortality, trends); completeness of reporting should be formally examined in all countries • Disease prevalence surveys to measure prevalence and change in selected countries, not incidence (donor funding e.g. GFATM) • Evaluate TB deaths, as part of mortality surveys (verify verbal autopsy) or development of vital registration • Tuberculin surveys more successful where transmission high, BCG coverage low; may or may not provide supporting evidence on transmission and its trend; application of Styblo rule questionable • Not all countries will measure all indicators by 2015; scientific consensus needed on which have met targets