
Quantitative proteomics - iTRAQ
E N D
Presentation Transcript
Harini Chandra Quantitative proteomics - iTRAQ a The identification and quantitation of complex protein mixtures have been facilitated by MS-based quantitative proteomic techniques. Isobaric tag for relative and absolute quantification (iTRAQ) consists of amine-specific, stable isotope reagents that can label peptides of upto eight different biological samples.
Master Layout (Part 1) 1 This animation consists of 2 parts: Part 1:iTRAQ Part 2: Application of iTRAQ Relative abundance A NH NH NH NH NH NH NH NH 2 m/z B Trypsin digestion SCX purification iTRAQ Label C 3 Samples combined D 4 Protein samples Peptide fragments LC-MS/MS analysis 5 Unwin, R. D. et al., Quantitative Proteomics Analysis Using Isobaric Protein Tags Enables Rapid Comparison of Changes in Transcript and Protein in Transformed Cells. Mol. Cell. Prot. 2005, 4:924-935.
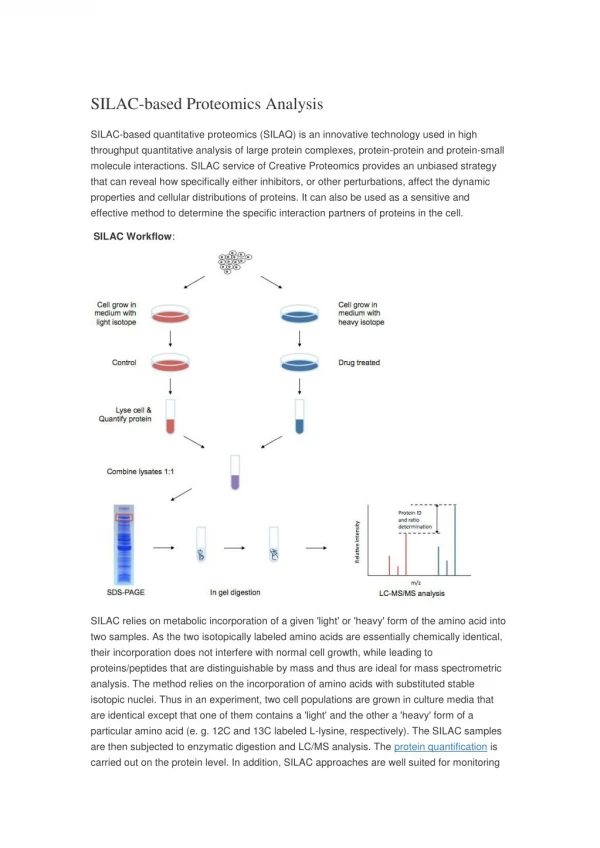
Definitions of the components:Part 1- iTRAQ 1 1. Isobaric Tag for Relative & Absolute Quantification: iTRAQ is a MS based technique for relative and absolute quantification of proteins present in up to four cell preparations by making use of four isobaric, isotope-coded tags that label the proteins via their N-terminal. 2. Protein samples: The samples whose proteins need to be quantified by iTRAQ procedure. 3. Trypsin digestion: Trypsin is a proteolytic enzyme that cleaves proteins at the C-terminal of arginine and lysine residues except when they are followed by proline. This enables large protein samples to be broken down in to small peptide fragments. 4. Peptide fragments: The smaller fragments obtained upon cleavage of the protein samples after trypsin digestion. 5. iTRAQ label: The iTRAQ reagent consists of a protein reactive group that labels the N-terminus of all peptides as well as free amine groups of lysine side chains, a neutral balance portion and a reporter group, giving it a total mass of 145. The different distribution of isotopes between the reporter and balance groups makes the labels isobaric and enables their detection upon fragmentation and release in MS. 2 3 4 5
Definitions of the components:Part 1- iTRAQ 1 6. SCX purification: Tagged peptides are fractionated on a strong cation exchange column to remove any unbound iTRAQ reagent and to simplify the peptide mixture. 7. LC-MS/MS analysis: The iTRAQ labeled peptides obtained are further purified by reverse phase liquid chromatography and then analyzed by tandem MS. Each tag releases a distinct mass reporter ion upon peptide fragmentation, the ratio of which determines the relative abundances of the peptides. 2 3 4 5
Part 1, Step 1: 1 2 A D B C Protein samples 3 Trypsin enzyme C-terminal N-terminal Trypsin Digested fragments 4 Action Description of the action Audio Narration The protein samples to be analyzed are first digested with trypsin into smaller peptide fragments. The trypsin cleaves the proteins at the C-terminal of lysine and arginine residues unless they are followed by a proline residue. First show the four beakers with the different colored ‘protein samples’ in them. Next show the hand appearing on top of all the beakers and drops falling from the pipette as shown. The hand must then disappear and the yellow circle must appear. The rectangle with dotted line must appear and must be zoomed into to show the image below. The orange ‘trypsin’ must move across the brown rectangle and must cut it at the green regions as indicated to give the smaller fragments below. As shown in the animation. 5
Part 1, Step 2: 1 115 iTRAQ labeling 30 2 R R R R 116 117 O B B B B 29 28 NH NH NH NH O N N 3 N O O H3C 114 31 4 D A B C Action Description of the action Audio Narration Show the smaller colored fragments in the beakers above. The chemical structure shown must be added to each of the beakers to generate the fragments shown in the beakers below. The peptide fragments generated are separated by SDS-PAGE to simplify the mixture and then tagged with the iTRAQ label. The iTRAQ reagent consists of a reporter group, a balance portion and a peptide reactive group that interacts with the N-terminus of the peptide or free amino group of Lysine residues, giving it an overall mass of 145. The reporter group used to label each peptide sample is unique, with mass varying between 114-117, thereby enabling the labeling and quantification of four samples simultaneously. This has been further improved to allow labeling of eight samples simultaneously. As shown in the animation. 5
Part 1, Step 3: 1 2 R R R R R R R R R R R R D A B C B B B B B B B B B B B B Samples pooled NH NH NH NH NH NH NH NH NH NH NH NH 3 4 Action Description of the action Audio Narration Show the four beakers on top and the bigger empty beaker below. The contents of the beaker on top must then be poured into the beaker below. The labeled samples are then pooled together. As shown in the animation. 5
Part 1, Step 4: 1 2 R R R R R R R R R R R R Sample loading Direction of migration B B B B B B B B B B B B NH NH NH NH NH NH NH NH NH NH NH NH Strong cation exchange column 3 Excess iTRAQ label removed 4 Action Description of the action Audio Narration Show the contents of the beaker being poured into the column. They must then flow through the column in the direction indicated and be collected in the empty beaker below. The pooled samples are purified on a strong cation exchange column to remove any excess unbound iTRAQ reagent. This facilitates sample clean-up prior to further finer separation and purification using reverse phase chromatography. As shown in the animation. 5
Part 1, Step 5: 1 LC-MS/MS analysis Column inlet from pump HPLC Pump 2 R R R R B B B B Injector Mobile phase NH NH NH NH 3 Sample Pump Column Column elution LC Column Sample injector Column outlet to detector Sample vials 4 Action Description of the action Audio Narration Show the beaker on top followed by the arrow. Then show the setup below with all its labels. The second and third boxes must be zoomed into to show the figures on the right. The ‘injector’ must enter the sample bottle with its plunger down. It must remain in this bottle for a couple of seconds and the plunger must be shown to move up. This must then move and be injected into the column. Liquid must be shown to flow through the tube connecting the ‘pump’ and ‘column’. Once the liquid flows, the colour in the column must change and the liquid must be shown to pass through the tubing at the outlet. Further purification of the SCX purified peptides is carried out by reverse phase liquid chromatography wherein the sample is passed through a column containing a packed stationary phase matrix that selectively adsorbs only certain analyte molecules. The eluted fractions are further characterized by MS. As shown in the animation. 5
m1 m2 m4 m3 Part 1, Step 6: 1 LC-MS/MS analysis Relative quantification determined by ratio of peptide pairs. Relative abundance 2 Detector m/z Peptide spectrum 3 ESI Quadrupole (scanning mode) Collision cell TOF tube Reflector 4 Action Description of the action Audio Narration First show all the components of the instrument – the syringe, four rods, cube, blue rectangle, gray square with the dotted lines & the detector. Next show appearance of the coloured circles. Only the red one must move through the rods and after entering the rectangular box, it must be fragmented to give smaller circles. These must migrate through the blue tube and get reflected to reach the ‘detector’. The smallest circles must move the fastest while the largest must move slowest. Once it reaches the detector, the graph on top must be shown. The purified labeled peptide fragments are then analyzed by MS/MS. The different masses of the reporter groups allows the peptide fragments to be identified. The reporter group is lost during fragmentation. Relative quantification of up to eight samples can now be performed using iTRAQ. As shown in the animation. 5
Part 1, Step 7 1 MASCOT LC-MS/MS data analysis proteomics@gmail.com Your name Email Proteomics Search title Sample protein Enzyme Database(s) SwissProt NCBInr MSDB Trypsin Trypsin Chymotrypsin Peptidase Quantitation iTRAQ 2 iTRAQ SILAC ICAT D8 Taxonomy Bacterial Mammalia Bacterial Plant Fixed modifications Carboxymethyl (C) 3 Variable modification Oxidation (M) # C13 0.2 Da Peptide tol. MS/MS tol. Da 1.2 Monoisotopic Peptide charge Average Data file Choose file Data format Precursor 4 Instrument Start search… ESI-Q-TOF MALDI-TOF ESI-Q-TOF MALDI-TOF-TOF Description of the action Audio Narration Action The MS/MS data analysis shareware has some extra inputs such as Quantitation, MS/MS tolerance, peptide charge, instrument etc. in addition to the fields for PMF. They require inputs from the user regarding the experimental parameters used such as enzyme cleavage, protein name, modifications etc. and the desired search criteria like taxonomy, peptide tolerance etc. Commonly used protein databases against which the MS information is processed to retrieve sequence data include NCBI, MSDB and SwissProt. The data file generated from MS is uploaded and the search carried out. As shown in animaion. First show the computer with the screen having a form on the inside. This must be zoomed into and the form above must be displayed. Each of the fields must be filled in as shown with some requiring selection using the white mouse pointer as depicted. 5
Master Layout (Part 2) This animation consists of 2 parts: Part 1:iTRAQ Part 2: Application of iTRAQ 1 2 Serum samples of normal healthy controls Immunodepleted serum 3 iTRAQ Immunoaffinity depletion 4 220 unique proteins identified, 14 of which were elevated in ovarian cancer serum samples. Serum samples of ovarian cancer patients 5 Boylan, K. L. M. et al., Quantitative proteomic analysis by iTRAQ for the identification of candidate biomarkers in ovarian cancer serum. Proteome Science 2010, 8:31.
Definitions of the components:Part 2- Application of iTRAQ 1 1. Normal healthy control: Normal healthy control refers to those who do not have the disease/condition that is being studied. The authors made use of 60 healthy control samples divided into six groups with ten in each. 2. Ovarian cancer patients: Serum samples from 60 patients with serous ovarian carcinoma were divided randomly into six groups, with ten patients in each group. 3. Immunoaffinity depletion: Immunoaffinity depletion is a process that is carried out in order to remove the high abundance proteins present in sera, which hamper the process of detection of medium or low abundance tumour derived protein markers. In this experiment, the authors made use of three commercial immunoaffinity depletion methods, the multiple affinity removal system (MARS), prior to proteomic analysis. 4. Immunodepleted serum: The serum from which the high abundance proteins have been removed, leaving behind only the medium and low abundance proteins thereby reducing the dynamic range, is known as immunodepleted serum. 2 3 4 5
Part 2, Step 1: 1 Immunoaffinity columns 2 Serum samples of normal healthy controls Immunodepleted serum 3 Serum samples of ovarian cancer patients 4 Action Description of the action Audio Narration First show the two tubes on the left with its components, These components must then be passed through the first column with pink beads. The blue dots must be shown to remain in this column and the remaining components must be passed through the second column in which the small dark green dots must remain behind and only the components shown in the tubes on the right must come out. A multiple affinity removal system was made use of to carry out immunodepletion of the serum samples from normal controls as well as ovarian cancer patients. This helped in removing the high abundance proteins, leaving behind only the medium and low abundance proteins for iTRAQ analysis. As shown in the animation. 5
Part 2, Step 2: 1 220 unique proteins identified, 14 of which were elevated in ovarian cancer serum samples. 2 Novel candidate biomarkers detected Normal healthy controls Concentration Immunodepleted serum iTRAQ analysis 3 Extracellular matrix protein-1 Leu-rich a-glycoprotein-1 LPS-binding protein Proteoglycan-4 Ovarian cancer patients 4 Action Description of the action Audio Narration First show the two tubes on the left with their components followed by the arrows showing the analysis by iTRAQ. Another arrow must appear from this followed by the graph and the text boxes as shown. The immunodepleted serum samples were then labeled with the iTRAQ reagent and analyzed. The authors detected a total of 220 unique proteins of which 14 were found to be elevated in the ovarian cancer serum samples compared to the healthy controls and four novel candidate biomarkers were detected. Results were validated by Western immunoblotting. As shown in the animation. 5
Interactivity option 1:Step No: 1 (a) 1 ADVANTAGES LIMITATIONS 2 2. Majority of proteins identified on basis of one peptide. Therefore low confidence of MS/MS data. 1. Quantification of up to eight samples possible 3 3. New search algorithms and databases needed. 5. Enhanced spectra assignment will reduce false positives 4. Ability to multiplex 6. Increased precision and accuracy 4 7.Expanded coverage of proteome Results Interacativity Type Options Boundary/limits User has to drag and drop the seven statements under the heading of either “advantages” or “limitations”. Statement (1), (4), (6) and (7) must come under advantages while (2), (3) and (5) must come under limitations. Everytime the user drags a statement correctly it must turn green, otherwise it must turn red and must be returned back to its original position. User must drag and and drop the seven statements given under the heading of either “advantages” or “limitations”. 5 Drag and drop.
Questionnaire 1 1. Which type of chromatography is used for removal of excess iTRAQ reagent prior to LC-MS/MS? Answers: a) Reverse phase b) Gel filtration c) Strong cation exchange d) Affinity chromatography 2. The total mass of the iTRAQ reagent is: Answers: a) 140 b) 143 c) 148 d) 145 3. Which region of the iTRAQ reagent has variable mass value? Answers: a) Reporter group b) Peptide-reactive group c) Balance region d) None of the above • A commonly used method for immunodepletion of serum samples: Answers: a) Gel filtration b) Multiple affinity removal systemc) Ion exchange chromatographyd) SCX 5. Which of the following statements regarding iTRAQ analysis is incorrect? Answers: a) iTRAQ can label all peptides in up to ten different biological samples b) iTRAQ reaction labels the N-terminus of peptides c) There is no reduction of peptides based on amino acid composition d) Reporter group is lost during fragmentation 2 3 4 5
Links for further reading Research papers: • Unwin, R. D. et al., Quantitative Proteomics Analysis Using Isobaric Protein Tags Enables Rapid Comparison of Changes in Transcript and Protein in Transformed Cells. Mol. Cell. Prot. 2005, 4:924-935. • Wiese, S. et al., Protein labeling by iTRAQ: A new tool for quantitative mass spectrometry in proteome research. Proteomics 2007, 7: 340-350. • Boylan, K. L. M. et al., Quantitative proteomic analysis by iTRAQ for the identification of candidate biomarkers in ovarian cancer serum. Proteome Science 2010, 8:31. • Ye, H. et al., A proteomic approach for plasma biomarker discovery with 8-plex iTRAQlabeling and SCX-LC-MS/MS. Mol. Cell Biochem. 2010, (epub ahead of print) PMID: 20526653. • Glen, A. et al., Eight-plexiTRAQ analysis of variant metastatic human prostate cancer cells identifies candidate biomarkers of progression: An exploratory study. Prostate 2010, (epub ahead of print) PMID: 20623638. • Hu, H.D. et al., iTRAQ quantitative analysis of multidrug resistance mechanisms in human gastric cancer cells.