Download
1 / 26
260 likes | 425 Views
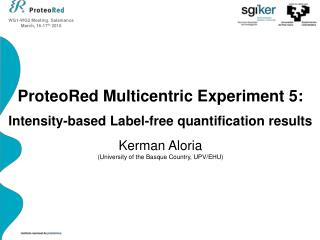
PROTEORED Multicentric Study QUANTITATIVE PROTEOMICS METHOD SPECTRAL COUNT 2010 UNIVERSITY OF BARCELONA. Salamanca 16 th March. Quantitative Proteomic Approaches • Label free – Spectral counting – Ion current based (Extracted ion chromatograms) – Other

E N D
PROTEORED Multicentric Study QUANTITATIVE PROTEOMICS METHOD SPECTRAL COUNT 2010 UNIVERSITY OF BARCELONA Salamanca 16thMarch
QuantitativeProteomicApproaches • Label free – Spectralcounting – Ion current based (Extracted ion chromatograms) – Other • Stableisotopelabeling – Stableisotopelabelreagent as ICAT and ITRAQ – Metaboliclabeling (SILAC, 15N) – Others ShotgunProteomics • Digestion of proteins and separationof peptides – Extensive chromatographic separation (one or mutliple dimensional separations, columns,..) • Data acquisition – Data-dependent acquisition (Automated acquisition of MS/MS spectrafrom as many precursor ions as possible) • Data analysis – Automated interpretation of the MS/MS spectra (DB search)
SpectralCountingSummary • Spectral count correlates well with protein abundance • Fold change can be calculated and statistically evaluated • Simple and straightforwardimplementation • Sensitive to protein abundance changes – for abundant proteins 2 fold change easily detected with high confidence Limitations • The response to increasing protein amount is saturable • Noisy data at low spectral counts – large difference in spectral count necessary to determine significant change Fu et al, 2006
Spectral count reflects relative abundance of a protein (r2 ≥0.99) Issuestoaddress: - Variability of Spectralcounts - Sensitivity of Spectral count to protein abundance changes - How to determine relative changes between two samples Variability of Spectralcounting LCMSMS analysis of replicate SCX fractions of K562 cell lysates, G-test Old W. et al, MCP 2005 How to determine relative changes between twosamplesFoldchangedetermination Old W. et al, MCP 2005 • Practical issue – no peptides found in one of the comparedsamples • Data discontinuity (spectral count – integers) – not amenabletoStudent t-test • Differences in samplingdepth Foldchangedetermination. RSC = log2[(n2 + f)/(n1 + f)] + log2[(t1 - n1 + f)/(t2 - n2 + f)] n1, n2 - spectral counts for sample 1 and 2 t1, t2 – total spectral count (sampling depth) for samples 1 and 2 f – correction factor 1.25 (Beissbarth et al – Bioinformatics 2004) Observed RSC correlateswellwith expected RSC for standard proteinsspikedintocomplexsamples (Old W. et al, MCP 2005)
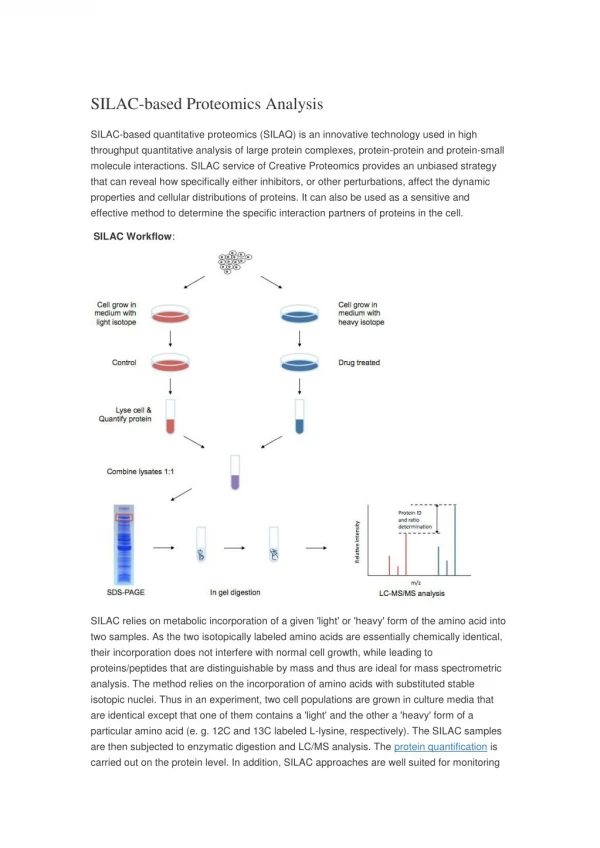
100 micrograms of each protein mixture A and B are dissolved • in 6M Urea /1% CHAPS, at 6 micrograms/microliter concentration. Samples were kept at -20ºC . Precipitation with TCA/ACETONE Re suspended in 100 uL 0.3 % SDS/50 mMTrisHCl pH 8.0/200 mM DTT 5 uL(5ug) Sample digested with trypsin O/N at 1/100 ratio Separate with nanoHPLC (4 replicas 1uL) MS/MS LTQ VelosOrbitrap
AnalysisSpectraanalyzed Proteored A1 11.976 Proteored A2 12.090 Proteored A3 12.567 Proteored A4 14.889 Proteored B1 14.444 Proteored B2 14.936 Proteored B3 15.115 Proteored B4 15.852 TOTAL 111.869 SEQUEST PARAMS peptide_mass_tolerance = 0.07 fragment_ion_tolerance = 0.6 diff_search_options = 15.9949 M 0.000 C 0.000 X
The Normalized Spectrum Counts bar chart shows a protein's relative abundance across different samples. The y-axis is the normalized count of the spectra matching any of the peptides in the protein. This count depends upon the protein, peptide, required mods and search filters set on the Samples page. Each bar along the x-axis is for a different biological sample. The bars are color coded. Each sample category is colored a different color. The bar chart can be used as a visual confirmation of a differential expression flagged by the Quantitative Analysis in the Samples view.
ALBUMIN_BOVIN SAMPLE A2 Xcorr 0.88 DeltaCn 0.46 P-value=0.52 SAMPLE A1 Xcorr 3.16 DeltaCn 0.43 SAMPLE B2 Xcorr 2.9 DeltaCn 0.57 SAMPLE A1 Xcorr 3.23 DeltaCn 0.64
ALDOA_RABIT SAMPLE A2 Xcorr 2.12 DeltaCn 0.5 P-value=0.0.00053 SAMPLE A3 Xcorr 5.33 DeltaCn 0.78 SAMPLE B3 Xcorr 5.35 DeltaCn 0.77
P-value=0.0.018 CYC_HORSE SAMPLE A1 Xcorr 4.78 DeltaCn 0.66 SAMPLE B3 Xcorr 5.46 DeltaCn 0.66
MYG_HORSE SAMPLE B1 Xcorr 3.87 DeltaCn 0.55 P-value=0.000019 SAMPLE A3 Xcorr 4.66 DeltaCn 0.72
CIC_HORSE MYG_HORSE ALDOA_RABIT
Conclusions: • Spectral count can be an easy way to try to perform quantitative proteome analysis, but : • Needs the ability to perform different LC runs with very low dispersion. • • The response to increasing protein amount is saturable. • • Noisy data at low spectral counts – large difference in spectral count necessary to determine significant change.
ProteomicFacilityUniversity of Barcelona M José Fidalgo Eva Olmedo Francisco Fernández Josep M Estanyol Oriol Bachs