Download
1 / 29
290 likes | 420 Views
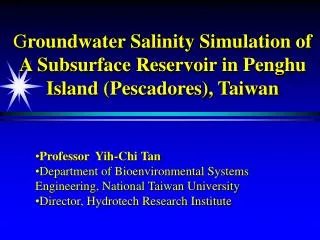
G roundwater Salinity Simulation of A Subsurface Reservoir in Penghu Island (Pescadores), Taiwan. Professor Yih-Chi Tan Department of Bioenvironmental Systems Engineering, National Taiwan University Director, Hydrotech Research Institute. INTRODUCTION. Chi-Ken subsurface reservoir

E N D
Groundwater Salinity Simulation of A Subsurface Reservoir in Penghu Island (Pescadores), Taiwan • Professor Yih-Chi Tan • Department of Bioenvironmental Systems Engineering, National Taiwan University • Director, Hydrotech Research Institute
INTRODUCTION • Chi-Ken subsurface reservoir • The subsurface reservoir is located in Chi-Ken Basin, Pescadores (a group islands located at western part of Taiwan, between Kinmen and Taiwan) • The reservoir has had the salinity problem since 1991
INTRODUCTION • annual average temperature is 23.3oC • average moisture is 80~85% • annual average rainfall is 913 mm • annual average ET rate is 1575mm • no single river in the basin; the major recharge of groundwater is by infiltration of rainfall
INTRODUCTION • basin area of the subsurface reservoir is 2.14 km2 • discharge of groundwater is 1.27×10⁶m3 • annual planning water supplies is 7.9×10⁵m3
Chi-Ken subsurface reservoir North-west toward south-east
Chi-Ken subsurface reservoir south toward north
What is subsurface reservoir? • subsurface reservoir
Possible salinity reasons of subsurface reservoir • shortage of rainfall • leakage of the subsurface barrier causes the intrusion of seawater • Percolation from weathering basalt
NUMERICAL MODEL • GMS (Groundwater Modeling System) • define soils layer data • hydro-geological parameters • initial conditions • boundary conditions • generation of three dimension meshes
NUMERICAL MODEL • A three dimension FEMWATER(Yeh , 1996) numerical model is adapted to find the possible leakage position of the subsurface barrier and location of seawater intrusion by comparing the different possible leakage simulated result with the observations
Location of subsurface barrier Subsurface barrier
HYDRO-GEOLOGICAL LAYERING • 1.The upper layer is white middle to grossly coralline sand with screenings coral, • 2. The middle layer is gray loam sand, • 3. The substratum layer is brownness clay, • 4.the bottom layer is weathering basalt • The major aquifer is in the upper and middle layers
determine the leakage position by numerical model • According to the observation data from Taiwan Water Supply Corporation (1998), the possible leakage positions of the subsurface barrier are: • the interface between barrier and baslt • the leakage of the subsurface barrier
determine the leakage position by numerical model • three hypothetical leakage cases • Case A1:leakage position is in the bottom part of the barrier • Case A2:leakage position is in the middle part of the barrier • Case A3:leakage position is in the upper part of the barrier
Case A1:leakage position is in the bottom part of the barrier
Case A1:leakage position is in the bottom part of the barrier The distribution of the chloride concentration for A1case matches with the observed values Groundwater levels distribution Chloride concentration distribution
Case A2:leakage position is in the middle part of the barrier
Case A2:leakage position is in the middle part of the barrier The numerical result for chloride concentration with 1000ppm of A2case and A3case are not comparable to the observed data Groundwater levels distribution Chloride concentration distribution
Case A3:leakage position is in the upper part of the barrier
A3:leakage position is in the upper part of the barrier The inland chloride concentration of A2case and A3case is lower than the observed data Groundwater levels distribution Chloride concentration distribution
CONCLUSIONS • By assuming the leakage position is in the bottom of barrier, the numerical result predicts values closer to the observation than the other assumption. It showed that the most possible leakage position is at the bottom of the barrier.
CONCLUSIONS • The research applied three dimension FEMWATER and GMS as an interface to input parameter. The simulation of water level and chloride concentration already shows the real situation, and the result can be applied to the future study of the Chi-Ken subsurface reservoir salinity problems.
The governmentdecided to rebuild another cutoff to prevent sea water intrusion, and it has been finished in last year. • It is very important that is to continue monitoring the water quality and preserve the limit water resources in this island.
Thank you very much and have a nice trip back to home