Download
1 / 18
180 likes | 362 Views
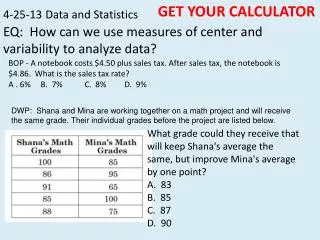
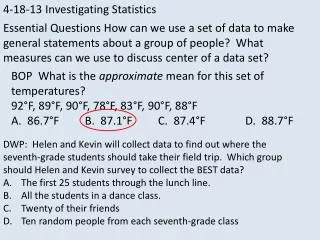
4-18-13 Investigating Statistics. Essential Questions How can we use a set of data to make general statements about a group of people? What measures can we use to discuss center of a data set? . BOP What is the approximate mean for this set of temperatures?

E N D
4-18-13 Investigating Statistics Essential Questions How can we use a set of data to make general statements about a group of people? What measures can we use to discuss center of a data set? BOP What is the approximate mean for this set of temperatures? 92°F, 89°F, 90°F, 78°F, 83°F, 90°F, 88°F A. 86.7°F B. 87.1°F C. 87.4°F D. 88.7°F DWP: Helen and Kevin will collect data to find out where the seventh-grade students should take their field trip. Which group should Helen and Kevin survey to collect the BEST data? The first 25 students through the lunch line. All the students in a dance class. Twenty of their friends Ten random people from each seventh-grade class
Check homework Math 7+ Workbook pages for lesson 3.3 Math 7 - Workbook
INVESTIGATING STATISTICS You can use the median and the mode of a set of data to describe what is typical about the distribution. They are sometimes call measures of center.Use the following ten names. Write each name on an index card and the number of letters in the name. ACTIVITY FROM CONNECTED MATHEMATICS, Data About Us, Investigation 1
Record your work for the following questions in your notebook. Order the cards from shortest name length to longest name length Identify the median a. How many numbers are to the left of the middle number? b. How many number are to the right of the middle number? 3. Remove two names from the original data set so that: a. The median stays the same. b. The median increases c. The median decreases. How does the median of the original data set change if you add a name a. With 16 letter? b. With 1,019 letter? Median 11 ½ letters You could remove the shortest name and the longest name. Adding a very large number has little effect on the median. Adding 1,019 has the same effect on the median as adding 16. The median would increase to 12 whether we added 16, 17, or 900 and 1000.
(Use the names given earlier) Using names given earlier to make a line plot. Draw a number line like the one below and place an X above the number for each value in the data set. Identify the mean, median, mode and range.
Suzanne has six pets. She made the line plot shown of her pets’ name lengths. What is the median length of her pets’ name? What is the mode length of her pets’ names? What is the range of her pets’ names?
WHAT DOES IT ALL MEAN? In your notes make a table:
WHAT DOES IT ALL MEAN? Mrs. Chalas and her class are discussing family size. She and five of her students made a stack of cubes to show the number of people in each of their households.
Answer the following questions: What are the median, mode, and range of the data set? 2. Mrs. Chalas’ class want to make all of the stacks the same height. How tall will the stacks be when they are evened out? What steps did you take to figure this out? The average stack height you found represents the mean number of people in a household. What is the mean number of people in a household?
Copy the table in your notebook. 4. How many people are in the 6 households altogether? What is the mean number of people per household? What are some ways you can determine the mean number of a set of data if you do not have cubes? Adapted by Connected Mathematics Data About Us Problem 3.1
The dot plot shows the writing scores for a group of students on organization. Describe the data using the mean, median and range.
The values range from 0 - 6. There is a peak at 3. The median is 3, which means 50% of the scores are greater than or equal to 3 and 50% are less than or equal to 3. The mean is 3.68. If all students scored the same, the score would be 3.68.
Exit Reflection What is meant by “measures of center?” Homework: Math 7+ Textbookp.140-141 #18-28, 33-39 Math 7 Handout