Download
1 / 49
490 likes | 513 Views
Comprehensive approach for sustainable wealth management addressing risk, growth, and income phases using dynamic asset allocation and risk management strategies. Expertly designed to meet long-term financial goals. Invest wisely with a disciplined process.

E N D
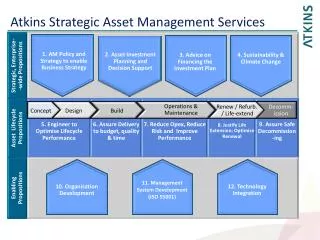
Strategic Asset Management Intellect Process Discipline
Good Better Best • Comprehensive Approach • Intellect Process Discipline • Small gains done repetitively produce significant results • Risk & reward not mutually exclusive but interdependent Core Beliefs
Value of 1% Source: OMG
Investment Plan Management Elements Tax Management Asset Selection Risk Management Purpose Platform
Needs and Goals • Accumulation Phase • Growth • Contingency & flexibility • Income Payout Phase • Sustainable • Deals with inflation • Contingency & flexibility Purpose
Needs • Capital deficiency • Lack of sustainable cash flow • Goals • Not achieving best outcomes Risk Management
Risk Management Define Global Objective RESOURCES Equity Return: 7.5% Required Return Example: 5.5% Global Objective: 50% Equity 50% Fixed Income NEEDS GOALS Fixed Income Return: 3.5% RISK TOLERANCE
Risk Management: Capital Deficiency Accumulation Phase Source: OMG Note: 1) An investor has $1,000,000 investable assets at age 40 and will deposit $100,000 each year until age 60; 2) the invested portfolio consists of 50% equities (represented by Ibbotson US Large Stock) and 50% bonds (represented by Ibbotson US Long-term Govt’ Bond); 3) the target real return for investors is 4.8%/yr.
Risk Management: Unsustainable Cash Flow Income Payout Phase OMG Source: Morningstar, OMG Note: 1) An investor has $1,000,000 investable assets at age 60 and will withdraw $51,000 each year until age 100; 2) the invested portfolio consists of 50% equities (represented by Ibbotson US Large Stock) and 50% bonds (represented by Ibbotson US Long-term Govt’ Bond); 3) the target real return for investor is 4.2%/yr.
Shortfall Probability Source: OMG Note: Shortfall probability is defined as the percentage of outcomes falling below the targeted outcomes by the end of the pre-defined investment horizons.
Risk Management Law of Numbers–Impact of Significant Loss Percentage of Gain Percentage of Loss Source: OMG
Risk Management Asset Class & Investment Horizon: Fixed Income VS Equities OMG Source: Morningstar, OMG Note: 1) An investor has $1,000,000 investable assets; 2) the equity component is represented by the Ibbotson US Large Stock Index, and the Fixed income component is represented by the Ibbotson US Long-term Gov’t Bond Index; 3) All returns are in real term.
Risk Management Dynamic Asset Allocation Global Objective: 50% Equity / 50% Fixed Income Projected 10-Year Equity Return Projected 10-Year Gov’t Bond Return Projected 10-Year Equity Risk Premium 25%
Dynamic Asset Allocation: Example Strategy Based on Projected Equity Risk Premium OMG Source: Morningstar, OMG
Dynamic Asset Allocation Growth of $1,000,000 OMG Source: Morningstar, OMG Note: 1) An investor has $1,000,000 investable assets; 2) All returns are in real term.
Dynamic Asset Allocation Performance Appraisal Portfolio Statistics: Risk/Reward Portfolio Statistics: Rolling Returns Source: Morningstar, OMG
Shortfall Mitigation: Dynamic Asset Allocation Accumulation Phase OMG Source: OMG Note: 1) An investor has $1,000,000 investable assets at age 40, and will deposit $100,000 each year until age 60; 2) the invested portfolio consists of equities and bonds with weights being determined by PRP model; 3) the target real return for investor is 4.8%/yr.
Shortfall Mitigation: Dynamic Asset Allocation Income Payout Phase OMG Source: OMG Note: 1) An investor has $1,000,000 investable assets at age 60, and will withdraw $51,000 each year until age 100; 2) the invested portfolio consists of equities and bonds with weights being determined by PRP model; 3) the target real return for investor is 4.2%/yr.
Shortfall Probability Source: OMG Note: Shortfall probability is defined as the percentage of outcomes falling below the targeted outcomes by the end of the pre-defined investment horizons.
Selection Choices • You • Broker • Professional Money Manager • Index • Criteria • Value: • Risk • Reward • Cost AssetSelection Choices & Criteria
Asset Selection Investment Committee • Members • Chairman & Chief Investment Officer • Jason Pouliot CFA, CFP • Board Representative • Bob Owens CFP, CH.F.C, CLU • Advisors • Jeff Owens CFP • Peter Boyd CPA, CA, CFP • Research Analyst • Sheldon Xie CFA, CAIA • Mandate • Guide overall investment strategy • Conduct money manager due diligence • Approve new investment products
Asset Selection Law of Numbers – Return VS Results Source: OMG
Asset Selection Law of Numbers – Return VS Results Source: OMG
Asset Selection Law of Numbers – Return VS Results Source: OMG
Asset Selection Law of Numbers – Return VS Results Source: OMG
Asset Selection Law of Numbers – Return VS Results Source: OMG
Asset Selection: 90/75 Equity Portfolio Upside Participation (90%) And Downside Protection (75%) Source: Morningstar, OMG Note: 1) An investor has $1,000,000 investable assets; 2) All returns are in real term.
Asset Selection: 90/75 Equity Portfolio Performance Appraisal Portfolio Statistics: Risk/Reward Portfolio Statistics: Rolling Returns Source: OMG
Shortfall Mitigation: 90/75 Equity Portfolio Accumulation Phase Source: Morningstar, OMG Note: 1) An investor has $1,000,000 investable assets at age 40 and will deposit $100,000 each year until age 60; 2) the tax saving is assumed to be 0.5% of the investment balance each year, and is used to increase the annual deposit; 3) the invested portfolio consists of 50% equities and 50% bonds; 4) the target real return for the investor is 4.8%/yr.
Shortfall Mitigation: 90/75 Equity Portfolio Income Payout Phase Source: Morningstar, OMG Note: 1) An investor has $1,000,000 investable assets at age 60 and will withdraw $51,000 each year until age 100; 2) the tax saving is assumed to be 0.5% of the investment balance each year, and is used to decrease the annual withdrawal; 3) the invested portfolio consists of 50% equities and 50% bonds; 4) the target real return for the investor is 4.2%/yr.
Shortfall Simulation Source: OMG Note: Shortfall probability is defined as the percentage of outcomes falling below the targeted outcomes by the end of the pre-defined investment horizons.
Fee deducibility • Elimination of ACB loss • Corporate class structure • Income Conversion • Return of Capital • Defer (potentially eliminate) accrual tax on fixed income asset • Strategic asset blueprint Tax Management Basket of Opportunities
Shortfall Mitigation: Tax Management Accumulation Phase Source: Morningstar, OMG Note: 1) An investor has $1,000,000 investable assets at age 40 and will deposit $100,000 each year until age 60; 2) the tax saving is assumed to be 0.5% of the investment balance each year, and is used to increase the annual deposit; 3) the invested portfolio consists of 50% equities and 50% bonds; 4) the target real return for the investor is 4.8%/yr.
Shortfall Mitigation: Tax Management Income Payout Phase Source: Morningstar, OMG Note: 1) An investor has $1,000,000 investable assets at age 60 and will withdraw $51,000 each year until age 100; 2) the tax saving is assumed to be 0.5% of the investment balance each year, and is used to decrease the annual withdrawal; 3) the invested portfolio consists of 50% equities and 50% bonds; 4) the target real return for the investor is 4.2%/yr.
Shortfall Probability Source: OMG Note: Shortfall probability is defined as the percentage of outcomes falling below the targeted outcomes by the end of the pre-defined investment horizons.
Shortfall Simulation: All Strategies Accumulation Phase Source: Morningstar, OMG Note: 1) An investor has $1,000,000 investable assets at age 40 and will deposit $100,000 each year until age 60; 2) the tax saving is assumed to be 0.5% of the investment balance each year, and is used to increase the annual deposit; 3) the invested portfolio consists of equities and bond with weights being determined by PRP models, and the equity component indexed to S&P 500 with upside and downside capture ratios being 90% and 75% respectively; 4) the target real return for the investor is 4.8%/yr.
Shortfall Simulation: All Strategies Income Payout Phase Source: Morningstar, OMG Note: 1) An investor has $1,000,000 investable assets at age 40 and will deposit $100,000 each year until age 60; 2) the tax saving is assumed to be 0.5% of the investment balance each year, and is used to decrease the annual withdrawal; 3) the invested portfolio consists of equities and bond with weights being determined by PRP model, and the equity component indexed to S&P 500 with upside and downside capture ratios being 90% and 75% respectively; 4) the target real return for the investor is 4.2%/yr.
Shortfall Probability Source: OMGNote: Shortfall probability is defined as the percentage of outcomes falling below the targeted outcomes by the end of the pre-defined investment horizons.
Security • Accessibility • Flexibility • Independence Platform IIROC
Platform Ongoing Management Ongoing Portfolio Management Monthly money manager due diligence Quarterly investment committee meetings Monthly portfolio review Client review meeting
Total Portfolio Fees OMG 3rd Party Money Manager Fees