Variable Frequency AC Source
Variable Frequency AC Source. Students: Kevin Lemke Matthew Pasternak Advisor: Steven D. Gutschlag. 1. Outline. Project overview High level block diagram Subsystems Lab work Equipment Future work. 2. Project Goals. Variable Frequency AC Source (VFACS)


Variable Frequency AC Source
E N D
Presentation Transcript
Variable Frequency AC Source Students: Kevin Lemke Matthew Pasternak Advisor: Steven D. Gutschlag 1
Outline • Project overview • High level block diagram • Subsystems • Lab work • Equipment • Future work 2
Project Goals • Variable Frequency AC Source (VFACS) • Capable of delivering 208 [Vrms] and 5 [A] • Sine wave frequency range from 0 to 60 [Hz] 3
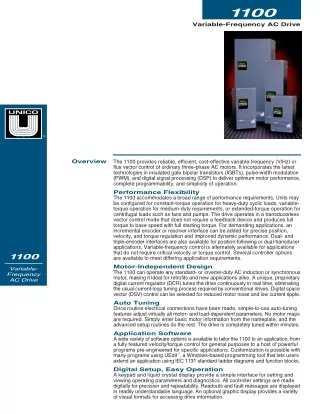
Project Significance • VFACS used to vary shaft speed in a three phase induction motors • Constant Volts/Hertz ratio to providevariable torque & speed operation without exceeding motor current ratings • Variable Frequency Drive (VFD) • Replaces control flow control valves in pump systems • Replaces gear box speed control • Improve operating power factor [1] 4
PWM Generation Controller • Produces dual sided PWM signals for the Gate Drive Circuitry • Use a LabVIEW based controller and cDAQ module from National Instruments • When completed, ability to control both single phase and three phase systems 6
Single-Phase PWM Generation Controller • Produce TTL level PWM signals • Produce waveforms representative of sine waves from 0-60 [Hz] • Combination of Upper and Lower PWM signals • Produced from Upper and Lower Triangle Waves • Produce waveforms following appropriate V/Hz based on DC rail voltage 8
Single-Phase PWM Generation Controller • Simulink based PWM Generation Controller • V/Hz control • Ideal LC Filter testing 9
Gate Drive Circuitry • High speed signal isolator and driver • Use optical isolators and gate driver chips to isolate and amplify gate drive signals to the Inverter • Optical isolators and gate drivers chosen for speed and robustness 10
Gate Drive Circuitry • Capable of switching at 1% duty cycle and 15 [kHz] switching frequency • Optical Isolator • 6N137 Optocoupler • Isolate cDAQ outputs from Inverter, Filter, and Load Voltages • Gate Driver • IR2110 • Amplify PWM from TTL level to Vge =15 [V] 12
Redesigned Gate Drive Circuitry Changes • Replaced IR2110/6n137 with HCPL3120 • Robustness • Real-estate • Simplicity • Verified that this chip would provide the same switching speed as the IR2110 [2] 13
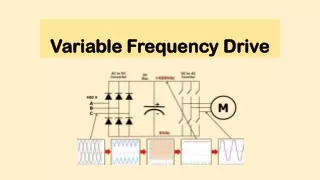
Inverter • PWM Signal Amplifier for AC machine application • Use IGBT pairs and DC rails to amplify PWM signal • IGBTs used for high voltage capability, low on-state voltage, and availability • Single- and three-phase configurations 14
Inverter Configurations • Single-phase Inverter • Fairchild FMG2G75US60 IGBT Pair • Each IGBT will receive one PWM signal • Output one dual-sided PWM signal representing the necessary sine wave • Have 0 and 100 [VDC] rails capable of providing 15 [A] for testing • Three-phase Inverter • Three single-phase inverters • Single-phase inputs 120⁰ out of phase from any other input pair • Capable of 5 [A] per phase • IRF520N MOSFETS for testing 17
Filter • LC filter • Used to extract sine wave encoded in PWM signal • Three identical filters used (one for each phase) • Components rated for 400 [V] and 15 [A] • Practical filter in LRC configuration LRC Filter Design Equations 18
Filter Updates Practical LRC Filter Frequency Response LR Motor Filter Frequency Response 19
Filter Updates • Analysis of three phase induction motor filtering capabilities • LRC meter to measure L & R of the motor to be used for testing • Comparison filtering characteristics of motor and proposed LC filter • Determined that inherent LR filter in the motor can replace the Filter subsystem 20
Load • Overall system output used for testing • Initially resistive-inductive (RL) for both single and three-phase systems • Final tests will be performed on a three-phase induction motor • Shall be able to draw the rated power from the system 21
Opto-coupler Simulation • 6N137 Opto-coupler Simulation] • PSPICE Circuit • Exported to Excel for plotting
Opto-coupler Simulation • Inverted output • Minimal rise time • 15 [kHz] test input signal
Gate Driver Testing • Gate Driver and Opto-coupler construction • HCPL3120 Gate Driver construction • HCPL3120 Gate Driver testing with IFR520N MOSFET single phase inverter • DC rails 0 and 18 [VDC] • +DC rail/2 5 [V] Ch1 Load Voltage Ch2 Load Current Single-Phase Inverter Test with IRF520N MOSFET 24
LabVIEW Data Type Testing • Basic cDAQ Interface • Analog Input • Digital Output (TTL) • Basic PWM Generation Controller in LabVIEW for data type testing • Point by Point vs Waveform data types 25
Basic Controller & Data Type Simulation • Simulation of basic, single-phase PWM generation controller • 1 [Hz] sine wave • 10 [Hz] triangle wave • 1 [kHz] sampling frequency 26 Single-Phase PWM Generation Controller Simulation
Controller Design • Based on Simulink model • Uses waveform data type • Configured for three phase operation • Built and output digital waveform from sine & triangle wave comparison 27
Sine and Triangle Wave Generation • Generate sine and triangle waves • User specified signal and sampling frequency • Extract amplitude value for comparison
PWM Signal Generation • Comparison of upper and lower triangle waves to sine wave for A-phase • Digital waveform generation • Used sampling information from sine and triangle wave generation • Digital waveform sent to output stage • B & C phase comparison uses 120° and 240° phase shift respectively
Output Stage Using DAQmx Toolkit • Digital waveform input to while loop • Create and write to physical channel on cDAQ • B & C phase output stages follow this design
Controller Simulation • Simulation of basic, three-phase PWM generation controller • 1 [Hz] sine wave • 15 [kHz] triangle wave • 150 [kHz] sampling frequency 31 Three-Phase PWM Generation Controller Simulation
Low Frequency Output Testing • PWM Generation Controller Test • 1 [Hz] Sine wave • 10 [Hz] Triangle Wave • 1 [kHz] sampling frequency Single-Phase Simulation Single-Phase Low Frequency Simulation 32
Low Frequency Output Testing • Oscilloscope graph of low frequency output test • Output matches digital waveform from LabVIEW scope Single-Phase Low Frequency Output Test
High Frequency Output Testing • PWM Generation Controller Test • 60 [Hz] sine wave and 15 [kHz] triangle wave • LabVIEW scope reading exported to excel 34
High Frequency Output Testing • Output from cDAQ as seen by oscilloscope • 60 [Hz] sine wave 15 [kHz] triangle wave • Waveforms from LabVIEW scope and oscilloscope match Single-Phase Upper Half PWM Signal High Frequency Output Test 35
Equipment & Parts List • LabVIEW Student Edition • NI-cDAQ-9174 Data Acquisition Chassis • NI-9401 Digital I/O • NI-9221 Analog Input Module • NI-9211 Thermal Couple • IR2110/2113 • 6N137 Opto-coupler • HCPL3120 Gate Driver • IRF520 MOSFET • FMG2G75US60 IGBT Pair with anti-parallel diodes • 7MBP75RA060-09 Inverter module • Sources and Scopes available in Power Lab 36
Future Work • Current Year • PWM Generation Controller • Volts/Hertz ratio • Simultaneous upper and lower PWM outputs • Load voltage feedback input • Future Years • Single phase inverter with FMG2G75US60 IGBT pairs • 7MBP75RA060-09 Inverter module • Three phase implementation 37
Questions? • References • [1] http://www.globalindustrial.com/p/motors/ac-motors-definite-purpose/explosion-proof-motors/baldor-motor-idxm7170t-10-hp-2700-rpm?infoParam.campaignId=T9F&gclid=CJa-kMDzhb4CFexcMgodOBsAWA&gclsrc=aw.ds • [2] www.avagotech.com/docs/AV02-0161EN 38
Switching Speed Calculation • FMG2G75US60 minimum switching speed • Switching speed = Gate Charge [nC]/ Gate Current [A] • Switching speed = 200 [nC]/ 2 [A] * 4 = 0.4 [μs] using maximum current for IR2110 and HCPL-3120 Plot of Gate Charge Characteristics for FMG2G75US60 39
Datasheets • http://www.fairchildsemi.com/ds/6N/6N137.pdf • http://www.daedalus.ei.tum.de/attachments/article/257/IR2110_IR2110S_IR2113_IR2113S.pdf • http://pdf.datasheetcatalog.com/datasheet/fairchild/FMG2G75US60.pdf • http://www.datasheetcatalog.com/datasheets_pdf/H/C/P/L/HCPL-3120.shtml • https://www.futurlec.com/Transistors/IRF520.shtml 40
Flow Chart 41
Pictures 44