
Uploaded by
veda-webb
1 SLIDES
312 VIEWS
50LIKES
400
DESCRIPTION
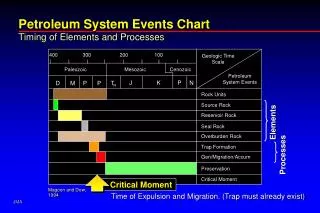
Petroleum System Events Chart Timing of Elements and Processes. 400. 300. 200. 100. Geologic Time Scale. Paleozoic. Mesozoic. Cenozoic. Petroleum System Events. J. K. P. N. D. M. P. P. T. R. Rock Units. Source Rock. Reservoir Rock. Elements. Seal Rock. Overburden Rock.
Download
1 / 1
Download Presentation 
400
An Image/Link below is provided (as is) to download presentation
Download Policy: Content on the Website is provided to you AS IS for your information and personal use and may not be sold / licensed / shared on other websites without getting consent from its author.
Content is provided to you AS IS for your information and personal use only.
Download presentation by click this link.
While downloading, if for some reason you are not able to download a presentation, the publisher may have deleted the file from their server.
During download, if you can't get a presentation, the file might be deleted by the publisher.
E N D
Presentation Transcript
Petroleum System Events Chart Timing of Elements and Processes 400 300 200 100 Geologic Time Scale Paleozoic Mesozoic Cenozoic Petroleum System Events J K P N D M P P T R Rock Units Source Rock Reservoir Rock Elements Seal Rock Overburden Rock Trap Formation Processes Gen/Migration/Accum Preservation Critical Moment Critical Moment Magoon and Dow, 1994 Time of Expulsion and Migration. (Trap must already exist)


More Related
Audio
Live Player