Antenna 1
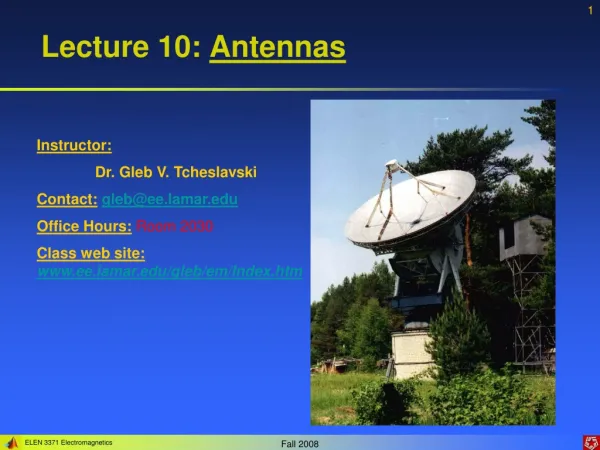
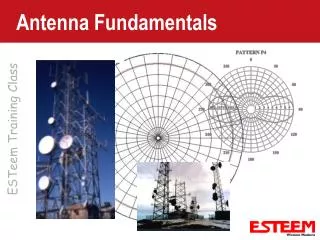
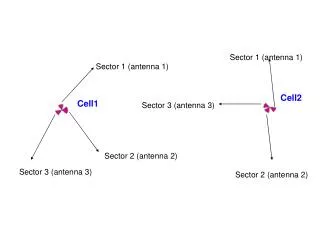
EISCAT-3D and active ionospheric experiments. Michael Rietveld EISCAT Scientific Association Tromsø Norway. Control. Antenna 1. Transmitter. Antenna 2. Antenna 3. Tromsø HEATING facility. 12, 100-kW vacuum tube amplifiers, class AB. temporary use as receive-only array.

Antenna 1
E N D
Presentation Transcript
EISCAT-3D and active ionospheric experiments Michael Rietveld EISCAT Scientific Association Tromsø Norway Control Antenna 1 Transmitter Antenna 2 Antenna 3
Tromsø HEATING facility 12, 100-kW vacuum tube amplifiers, class AB temporary use as receive-only array
Heating can produce high electron temperatures and artificial light emission. Electron temperature Intensity of red line Intensity of green line Gustavsson et al, PRL, 2006
The artificial auroral structure at 16:37:05 UT on12 November 2001, 5 s after HF pump turn on. Integration time =5 s. The image is taken in the zenith from Skibotn and has a 50º field of view (large circle). The -3 dB locus of the pump beam assuming free space propagation is shown as a small circle (beamwidth = 7.4º), projected at 230 km altitude and tilted 9º south of the HF facility at Ramfjordmoen. The upper cross shows the location of the HF transmitter whilst the lower cross shows the magnetic field line direction (12.8º S), both projected at 230 km. The dotted line represents the magnetic field line connected to Ramfjordmoen and the labels give altitude.(from Kosch et al., GRL, 2004)
The facility started operation in 1980 • It runs only about 200 hours a year • So it can probably run another 10 years or so without major repair costs. • The low-power RF generation and control software has just been upgraded (DDS synthesizers- faster frequency changes) • We are investigating operation at the 2nd gyroharmonic (2.71 MHz)
Characteristics of Heating phenomena • Langmuir turbulence has time scales of milliseconds; thermal effects in the F region seconds. • Horizontal Spatial scales of excited phenomena range from 10’s of m to ~100 km • Many phenomena show a strong geometrical dependence on angle to the geomagnetic field. requiring volumetric imaging of the ionosphere within ± ca. 15° of HF beam direction, like EISCAT-3D could do
Topside Z-mode effect and the radio window strong backscatter = coherent echoes Horizontally localised strong backscatter (antenna positions 1° apart, 30s in time) Vertically localised strong backscatter (range bins ca. 2 km apart) Ashrafi, Kosch et al., work in progress
PMSE overshoot immediately after switching the 20s long heater pulse off. Smoothed data 20s 160s Total PMSE intensity (sum of highest intensities at each time sample) Raw data The background noise on this linear scale is at approximately 2500. (from Havnes et al., GRL, 30, 2229, 2003.)
Polar Mesospheric Winter Echoes (PMWE) • Weaker than PMSE • Lower altitude than PMSE • Not associated with NLC • Not during extreme cooling Want: Incoherent scatter spectra from 60-90 km with good (100’s m) spatial resolution (to measue Te changes, and electron density bite-outs associated with PMSE)