Download
1 / 31
310 likes | 515 Views
Cellular decision-making bias: the missing ingredient in cell functional diversity Bradly Alicea http://www.msu.edu/~aliceabr/ http://syntheticdaisies.blogspot.com. Rais et.al Deterministic direct reprogramming of somatic cells to pluripotency . Nature (2013).

E N D
Cellular decision-making bias: the missing ingredient in cell functional diversityBradlyAliceahttp://www.msu.edu/~aliceabr/http://syntheticdaisies.blogspot.com
Rais et.al Deterministic direct reprogramming of somatic cells to pluripotency. Nature (2013) Typical four factors reprogramming (e.g. iPS) is inefficient and highly variable (e.g. stochastic dynamics). Rais et.al discover a way to make process deterministic.
Mbd3+/- iPS lines (DOX-inducible cassette) Host Blastocyst (mouse) Differentiate into MEFs Reprogrammed to iPS (with latency)
But what about these? (1-efficiency) In Rais et.al (2013), “inefficiency” (the presence of un-reprogrammed cells) is characterized as a rate-limiting barrier. Success! (efficiency) • How do you overcome rate-limiting factors? • 1) Deplete Mbd3 (nucleosome remodeling and deacetylation repressor complex). • 2) Promotion of naïve pluripotency conditions. • Reprogramming factors exist in a dynamic equilibrium: • * Reactivate endogenous pluripotency networks (positive signal). • * Directly recruits Mbd3/NuRD repressor complex (negative feedback signal for reactivating this network).
Mbd3+/- iPS lines (DOX-inducible cassette) Reprogramming Latency (per Hanna, 2009 and Rais, 2013) t(μ) Host Blastocyst (mouse) time (δ) Differentiate into MEFs Early Reprogrammers Late Reprogrammers Mbd3f/-is necessary but not sufficient (by itself) to achieve deterministic reprogramming Reprogrammed to iPS (with latency)
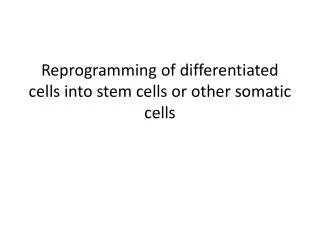
B Cells, Hanna et.al, 2009 Fibroblasts, Alicea et.al, 2013 MUSE Cells, Dezawa et.al, 2013 STOCHASTIC Differences in cellular identity ELITE DEMOCRATIC Differences in pathway regulation MEFs Rais et.al, 2013 DETERMINISTIC
Mbd3 is depleted, reprogramming efficiency promoted (using floxed and negative allele). Mbd3 is expressed normally, efficiency is low and/or highly variable.
Even when Mbd3 is depleted, factor expression (GFP+) is still variable across colonies.
“Gas and Brakes” model: Figure 5, frame F For more information, see: McDonel, P., Costello, I., and Hendrich, B. Keeping things quiet: Roles of NuRD and Sin3 co-repressor complexes during mammalian development. International Journal of Biochemistry and Cell Biology, 41(1), 108-116 (2009).
From a systems perspective Core Pluripotency Factors “Gas and Brakes” model: Figure 5, frame F ( - ) ( + ) Mbd3/NuRD repressor complex For more information, see: McDonel, P., Costello, I., and Hendrich, B. Keeping things quiet: Roles of NuRD and Sin3 co-repressor complexes during mammalian development. International Journal of Biochemistry and Cell Biology, 41(1), 108-116 (2009).
Yet epigenetic regulation does not tell the whole story. Are there higher-level organizational factors at play? • Buganim et.al, Cell, 150(6), 1209-1222 (2012). • Difference between early and late reprogramming: • * early phase = core genes in pluripotency network exhibit mass upregulation (genes act independently). • * late phase = core genes in pluripotency network exhibit hierarchical dependence (above).
Rais et.al assumption: all cells reprogram to iPS, and occurs with uniform latency (no intrinsic differences in cell population). Violation of assumption: what happens when cells exhibit variation? Or when one subpopulation is favored?
Question to keep in mind: Is there a necessary relationship between the presence of a favored subpopulation and reprogramming being a uniformly-distributed event? iSM
The creation of “deterministic reprogrammers” relies upon minimizing the variability in regulatory mechanisms (e.g. industrial process). * This is not normally found in nature, but systematic variation may exist between conversion regimens (e.g. iN, iSM). * I/O problem: transcription factor induction (input) and destination phenotype (output). * are all forms of conversion equal, or are certain types of conversion (iPS, iN, iSM, iCM) easier to achieve? Reprogramming bias: tendency for some cell lines to favor a certain destination phenotype upon reprogramming.
Reprogramming Bias Phenotypic (H1): * induced phenotype A vs. induced phenotype B (e.g. iNC, iSMC). Genomic (H2 and H3): * pre-existing bias, gene expression in different cell types before the transformative process. * induced bias, gene expression after a transformative process has occurred. Extrinsic (H4): * tied to survivability of cells, does signal spectrum of a phenotype overlap with that of cells put under defined (survival) conditions?
Reprogramming Bias H2 (induced bias) H3 (pre-existing bias) H1 (phenotypic bias)
Building a signal spectrum (histogram): • * requires experimental replicates. • * rank-order frequency method. • Sparse histogram: • * provides a multimodal distribution for further analysis.
Classical SDT Cellular SDT Signal and Noise are distinct Signals are distinct Overlap = O(n,m) Overlap = d’ Signal and Noise overlap Signals overlap
Reprogramming Bias O(N,M) = Σ MAX(Ni,Mi) - ||Ni – Mi|| OVERLAP (N and M) MAXIMUM (ith element N, ith element M) Taken from a rank-order frequency spectrum for same cell lines. KIDNEY HEART OVERLAP (N and M) FREQUENCY RANK ORDER (CELL LINES IN ANALYSIS)
Reprogramming Bias O(N,M) = Σ MAX(Ni,Mi) - ||Ni – Mi|| Cell lines from some tissues (kidney, skeletal muscle) show bias for one type of conversion over another.
Reprogramming Bias O(N,M) = Σ MAX(Ni,Mi) - ||Ni – Mi|| PROCESS DIAGRAM Cell lines from some tissues (kidney, skeletal muscle) show bias for one type of conversion over another.
Pre-existing Bias Fibroblasts from 13 mouse fibroblasts cell lines known to exhibit differential reprogramming between muscle and neuron. * high-throughput case (two breast and one lung line) exhibit no distinct pattern of bias, interesting (single probe) local differences. Distributions are uniform with no tails, smear into one another (e.g. no bias).
Induced Bias Human Fibroblasts under various drug treatments Translatome (Blue), Transcriptome (Red) A = COL1A, B = Fibronectin, C = UTF • All three genes: significant overlap for both fractions of RNA: • * differences between genes: high-rank skew for COL1A, low-rank skew for UTF. • * COL1A, UTF: intermittent expression? • High-throughput case (fibroblasts under Vitamin C treatment): • * differences are inconclusive.
Survivability O(S,M) = Σ MAX(Si,Mi) - ||Si – Mi|| OVERLAP (S and M, S and N) MAXIMUM (ith element S, ith element N or M) Taken from a rank-order frequency spectrum for same cell lines under survival conditions.
Survivability O(S,M) = Σ MAX(Si,Mi) - ||Si – Mi|| OVERLAP (S and M, S and N) MAXIMUM (ith element S, ith element N or M) Taken from a rank-order frequency spectrum for same cell lines under survival conditions. KIDNEY HEART OVERLAP (S and M) FREQUENCY RANK ORDER (CELL LINES IN ANALYSIS)
2-dimensional Genotype Space iN iSM Stochasticity w.r.t. time (δ) BIAS Naïve ground state BIAS iPS Schematic of a Random Walk, step size based on non-uniform distribution (semi-Levy Flight).
Reprogramming Model of Rais et.al, 2013 (inducible factors) 12d Kurtosis = efficiency of process (rate-limiting factors). 4d Theoretical Maximum Efficiency (e.g. 40%) Skew = variability in process. 12d time (δ)
Reprogramming Model of Rais et.al, 2013 (inducible factors) 12d Kurtosis = efficiency of process (rate-limiting factors). 4d Theoretical Maximum Efficiency (e.g. 40%) Skew = stochasticity in process. 12d δ Model used here assumes that reprogramming events over time can be drawn from a Gaussian (e.g. uniform) probability distribution. For each day, a certain proportion of cells convert. Above, 12d sees the maximum number of conversions.
12d Is reprogramming according to a uniform distribution a reasonable assumption? * model matches observations of reprogramming using inducible factors, but perhaps this has little relevance to the biology of process. 4d time (δ)
12d Is reprogramming according to a uniform distribution a reasonable assumption? * model matches observations of reprogramming using inducible factors, but perhaps this has little relevance to the biology of process. 4d time (δ) Infectability Data (inducible YFP signal) 4d 12d Conversion Rate Mouse Cell Lines
12d Is reprogramming according to a uniform distribution a reasonable assumption? * model matches observations of reprogramming using inducible factors, but perhaps this has little relevance to the biology of process. 4d time (δ) Infectability Data (inducible YFP signal) 4d Converting to iN and iSM phenotypes results in variable distributions. This suggests the reprogramming process might be better modeled using a exponential rather than a Gaussian. 12d Conversion Rate Mouse Cell Lines