Download
1 / 3
30 likes | 151 Views
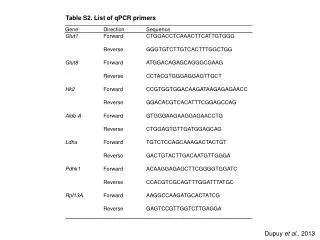
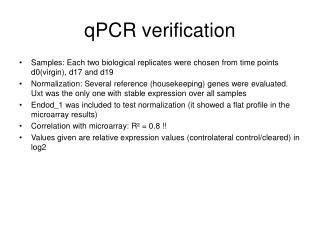
qPCR of Reprogramming Candidates. Samples: Each two biological replicates were used from time points d0(virgin), d10, d15, d17 and d19 Normalization: Samples are normalized to Uxt Values given are relative expression values (controlateral control/cleared) in log2 Notes:

E N D
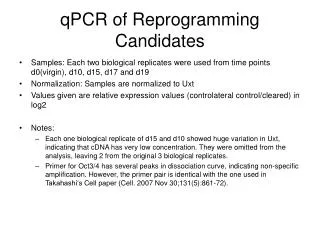
qPCR of Reprogramming Candidates • Samples: Each two biological replicates were used from time points d0(virgin), d10, d15, d17 and d19 • Normalization: Samples are normalized to Uxt • Values given are relative expression values (controlateral control/cleared) in log2 • Notes: • Each one biological replicate of d15 and d10 showed huge variation in Uxt, indicating that cDNA has very low concentration. They were omitted from the analysis, leaving 2 from the original 3 biological replicates. • Primer for Oct3/4 has several peaks in dissociation curve, indicating non-specific amplification. However, the primer pair is identical with the one used in Takahashi‘s Cell paper (Cell. 2007 Nov 30;131(5):861-72).
Raw values of biological replicates *omitted