Download
1 / 21
210 likes | 287 Views
Explore the impact of wind energy on bird populations, from fatalities to habitat displacement. Discover strategies for minimizing adverse effects and promoting sustainable energy practices.

E N D
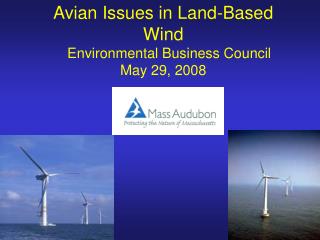
Avian Issues in Land-Based Wind Environmental Business Council May 29, 2008
“I honestly beleave it iz better tew know nothing than two know what ain’t so” Josh Billings, 19th C
Wind Energy and Birds Endangered Species Act Migratory Bird Treaty US DOI Wind Turbine Advisory Committee (http://www.fws.gov/habitatconservation/windpower/wind_turbine_advisory_committee.html)
Population trends of U.S. breeding speciesData are from the 415 native species with adequate BBS sample sizes for analysis From: Greg Butcher, National Audubon, State of the Birds USA presentation 2004
1996 What Can Happen in 50 Years? 1943
Vivian Stockman, May 30, 2003 Mountain Top Mining West Virginia A “typical” mine encompasses 1,000 – 4000 acres of ridge line during the mine’s lifetime EPA 2003 MTRVF PEIS
2003 Buzzard’s Bay Oil Spill (San Francisco, Black Sea 2007)
Wind Energy Birds(and Bats) Possible Impacts(NAS 2007) • Habitat destruction and fragmentation • Habitat displacement • Collision mortality • None of these are unique to wind, but differ by degree, perhaps
Bird Fatalities at Wind Turbines(NRC 2007, Jain et al. 2007*)
Bat Fatalities at Wind Turbines(Kunz et al. 2007, Jain et al. 2007*)
Maple Ridge, Lewis County, NY (195, 1.65 MW Turbines)
Maple Ridge, NY2006 (per MW) *Golden-crowned Kinglets: 29 – 43% of observations!!! Most birds found at one turbine = 9
Sources of Bird Mortality(Erickson, et al. 2001; NRC 2007) • Communications Towers – 4 million to 50 million • Buildings and Windows – 98 million to 980 million • Vehicles – 60 million to 80 million • Cats – 8 million to 220 million (rural cats) • Wind Turbines – 10,000 to 40,000 (3.1 birds per MW installed capacity; 0.003% of all sources of human-caused avian mortality) • Estimated 10 – 20 billion land birds in North America
Bird Mortality And Communication Towers Michigan Spring 2005 Joelle Gehring
Potential Collision Mortality • Current estimate = 3.1 birds per MW installed capacity (NRC, 2007) • 1 MW installed generates 2.4 – 3 million kWh per year (AWEA) • Massachusetts 2000 electricity = 52,663 million kWh (U. S. Census Bureau) • If 100% from wind, ~53,000-66,000 birds/year • Mostly passerines, except corvids – significance depends on species, e.g., raptors, state-listed species
Needs and Challenges. I Defining preconstruction site assessments – identify risk factors Cumulative and population-level impacts Collision mortality Habitat loss/displacement Defining thresholds – what is unacceptable? Project Size –single turbine versus utility scale projects
Needs and Challenges. II Adaptive Management – opportunities for learning Post-construction monitoring BACI (before-after control investigations) Bats – test several hypotheses explaining high bat mortality American Wind and Wildlife Institute (AWWI)
Closing All energy use has an impact Increase energy conservation and energy efficiency – reduce fossil fuel use Increase use of renewable energy including wind Site wind projects to minimize environmental impact – reduce resolvable uncertainty