Download
1 / 14
140 likes | 315 Views
The Darling River in drought: where does all the water go and how can isotopes help us find out?. Cath Hughes With input from Dioni Cendon, John Gibson, Stuart Hankin, Suzanne Hollins, Karina Meredith and David Stone & the invaluable collaboration of the NSW Dept of Water and Energy.

E N D
The Darling River in drought:where does all the water go and how can isotopes help us find out? Cath Hughes With input from Dioni Cendon, John Gibson, Stuart Hankin, Suzanne Hollins, Karina Meredith and David Stone & the invaluable collaboration of the NSW Dept of Water and Energy FIELD ASSISTANT AT TILPA PUB
Murray Darling Basin Annual Rainfall Recent drought years 2001-6 similar rainfall to first half of 20th century – so why is this drought so severe? Murray Darling Basin Annual Rainfall Anomaly (base 1961-90) Higher temperatures and potential evaporation Increased water diversions Murray Darling Basin Annual Mean T Anomaly (base 1961-90) Climate context Avg Rainfall = 500 mm/yr <200mm/yr to >1200mm/yr Avg Potential E = 2000 mm/yr
If all the diversions now in place were there during 1920’s to the 1940’s the flow in the river would have been halved OBSERVED FLOWS Past and present river flows – – – Natural median annual flow River flow modelling from the NSW Dept of Water and Energy shows the effect of dams, weirs and pumping for irrigation for last 90 years PAST FLOWS MODELLED FOR CURRENT DIVERSION CONDITIONS MEDIAN FLOW MORE THAN HALVED BY DIVERSIONS 5-10 FOLD INCREASE IN DIVERSIONS SINCE 1980’s Climate change and variability may affect water supply and demand but human water use and catchment management have a very big impact! – – – Current median annual flow DNR NSW Drought Analysis 2006
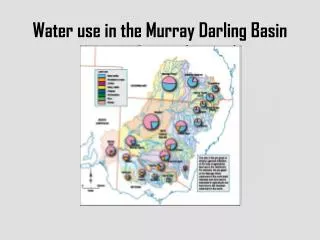
Cotton irrigation storage dam Cotton irrigation near Bourke Water diversions • 1650 GL/year water use from catchment • 310 GL/year water use from Barwon-Darling River reaches in this study • 300 GL storage capacity in shallow dams (max depth <5m) • Summer temps high 30’s to mid 40ºC leading to high evaporation rates Thanks to Google Earth
Saline groundwater at Glen Villa weir 19A FISH KILL AT GLEN VILLA
Where do isotopes come into the equation? Isotopes have the same atomic number but different numbers of neutrons in the nucleus – they can be stable or radioactive - natural or anthropogenic. In some water molecules either a 1H or 16O atom is replaced by its ‘heavier’ cousin – 2H or 18O. Heavy or ‘enriched’ molecules condense or rain out quicker and evaporate slower so they can be used to study hydrological processes. Deuterium or 2H atoms were formed during theBIG BANG! Abundance 18O=2005.2 ppm, 2H=155.75 ppm – expressed as ratio of the standard VSMOW in per mille ‰
(Gibson et al. 2002) Darling Basin stable isotopes & evaporation • Extreme evaporative enrichment in Barwon-Darling, tributaries and reservoirs • The degree of enrichment can be used to determine how much water has evaporated
Evaporation can be seen in one place in time… 0.2 0.3 0.4 isotope values increase between floods at Wilcannia 0.5 0.6 0.7 0.8 0.9 … or over distance as we travel down river 1.0 20000 15 10 15000 5 O (‰) 10000 Daily discharge (ML) flood front 0 18 d 5000 -5 0 -10 1/7/02 1/7/03 1/7/04 1/7/05 Imagine the river is like a cup of water left out in the sun – in a river it’s not so easy to measure how much water evaporates but using isotopes we can… GMWL D = 818O+10
The Darling River is dying of thirst… Big dams and water extraction for irrigation of cotton and other crops are taking the water the river needs. Weirs along the river allow water to evaporate, contaminants to concentrate and algal blooms to flourish…WHAT EFFECT WILL CLIMATE CHANGE HAVE?
Why be an environmental scientist/engineer?Contribute to the planet, have fun, visit great places!