Download
1 / 28
280 likes | 387 Views
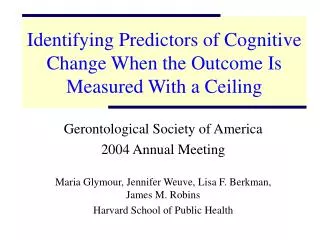
Identifying Predictors of Cognitive Change When the Outcome Is Measured With a Ceiling. Gerontological Society of America 2004 Annual Meeting Maria Glymour, Jennifer Weuve, Lisa F. Berkman, James M. Robins Harvard School of Public Health. Outline. The question Why it’s difficult to answer

E N D
Identifying Predictors of Cognitive Change When the Outcome Is Measured With a Ceiling Gerontological Society of America 2004 Annual Meeting Maria Glymour, Jennifer Weuve, Lisa F. Berkman, James M. Robins Harvard School of Public Health
Outline • The question • Why it’s difficult to answer • How CLAD regression helps • An example with HRS data
The Question • Does education affect cognitive change in old age? • Earl attended 10 years of school and declined by 2 points on a cognitive test score from age 70 to 75. Would Earl have experienced more or less cognitive change if he had, counter to fact, completed more schooling?
Indirect Measurement of Cognition • Test is an indirect measure of our primary interest (cognitive function): Test Score=g(cognition) + e • But the test has a maximum possible score: Test Score=min(15, g(cognition) + e)
Scaling Challenges True Cognitive Status Values Low High Maximum text score Measured Test Score
Measurement Ceilings A ceiling on the dependent variable will bias the regression coefficient away from the coefficient for the true outcome variable.
36 36 34 34 32 32 30 30 28 28 26 26 24 24 22 22 20 20 18 18 16 16 0 1 Time Ceilings with Longitudinal Data Difference in True D = 0 Observed = -3
36 36 34 34 32 32 30 30 28 28 26 26 24 24 22 22 20 20 18 18 16 16 0 1 Time Ceilings with Longitudinal Data Difference in True D = 0 Observed = 3
800 Test Score 600 400 200 0 Median Mean Medians vs Means 800 600 400 Cognitive Status 200 0 Mean, Median
CLAD Regression • The median is more robust to ceiling effects than the mean, so contrast medians by level of exposure • Use CLAD if believe the relationship between X and Y does not differ above (vs below) the ceiling • Calculate the median regression coefficients • Drop observations with a predicted value of Y over ceiling • Repeat steps 1 and 2 until all predicted values are below the ceiling. • Standard errors are messy: bootstrap. • Can use any quantile
Data Set • AHEAD cohort of HRS • Enrolled in 1993 • National sample of non-institutionalized survivors born pre-1924 • n=7,542, Observations=23,752 • Self-report years of education: dichotomized at <12 years • Telephone Interview for Cognitive Status (modified) • Possible range 0 (bad) -15 (good) • ~20% scored max at each interview • Assessed 1-5 times
TICSti = b00 + b1Timeti + b2Educationi + b3Timeti*Educationi + bkOther Covariatesti + ei Bootstrap (500 resamples) for standard errors, resampling on the individual (rather than the observation) Analysis
Other covariates: Age at enrollment, mother’s education, father’s education, Hispanic ethnicity Stratify by sex and race (black vs all other) Up to 5 cognitive assessments Initial models treat time flexibly Impose a linear model of time Analysis
Predicted Median TICS Score From CLAD models, adjusted for sex, race, age at baseline, Hispanic ethnicity, mother’s and father’s education
(Less Desirable) Alternatives • Baseline adjustment • Introduces new (and larger) biases • Add the scales • Hides the ceiling • Hides the bias • Tobit models • Stronger assumptions about the distribution
Conclusions • More educated respondents had much higher average cognitive scores for the duration of the study. • Education associated with better evolution of cognitive function for white women. • Ceilings introduced bias of unknown direction.
Limitations & Future Work • Discrete outcomes • Missing data • Complex sampling design • Unequal scale intervals not due to ceilings
Acknowledgements • Dean Jolliffe, CLAD ado • Funding: • National Institute of Aging • Office for Behavioral and Social Science Research • “Causal Effects of Education on Elder Cognitive Decline” • AG023399 • NIA Training grant: AG00138
True Cognitive Status Values Low High Measured MMSE Unequal Scale Intervals
6 4.0 3.5 5 3.0 4 2.5 function=square root of errors Function=ln(score) 3 2.0 1.5 2 1.0 1 0.5 0 - 0 5 10 15 20 25 30 Test Score Unequal Scale Intervals Do similar size increments have the same “meaning” across all levels of the test?
Unequal Scale Intervals Do similar size increments have the same “meaning” across all levels of the test?
Unequal Scale Intervals Do similar size increments have the same “meaning” across all levels of the test?