Program Assessment Chart (PAC) Guidelines for Effective Contract Management
The Program Assessment Chart (PAC) Instructions provide a comprehensive framework for assessing contractor performance, cost risks, and program issues. It outlines the necessary charts including an overview, major issues, cost drivers, performance parameters, and risk analysis, focusing on critical elements that could impact project success. This structured approach ensures that all stakeholders receive essential insights needed for informed decision-making and timely interventions. The PAC serves as a vital tool for monitoring program health and generating executive-level visibility into contractor management and overall program execution.

Program Assessment Chart (PAC) Guidelines for Effective Contract Management
E N D
Presentation Transcript
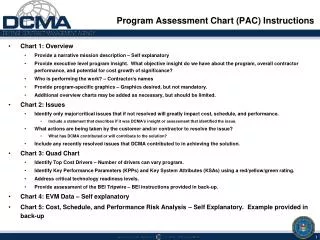
Program Assessment Chart (PAC) Instructions • Chart 1: Overview • Provide a narrative mission description – Self explanatory • Provide executive level program insight. What objective insight do we have about the program, overall contractor performance, and potential for cost growth of significance? • Who is performing the work? – Contractor/s names • Provide program-specific graphics – Graphics desired, but not mandatory. • Additional overview charts may be added as necessary, but should be limited. • Chart 2: Issues • Identify only major/critical issues that if not resolved will greatly impact cost, schedule, and performance. • Include a statement that describes if it was DCMA’s insight or assessment that identified the issue. • What actions are being taken by the customer and/or contractor to resolve the issue? • What has DCMA contributed or will contribute to the solution? • Include any recently resolved issues that DCMA contributed to in achieving the solution. • Chart 3: Quad Chart • Identify Top Cost Drivers – Number of drivers can vary program. • Identify Key Performance Parameters (KPPs) and Key System Attributes (KSAs) using a red/yellow/green rating. • Address critical technology readiness levels. • Provide assessment of the BEI Tripwire – BEI instructions provided in back-up. • Chart 4: EVM Data – Self explanatory • Chart 5: Cost, Schedule, and Performance Risk Analysis – Self Explanatory. Example provided in back-up
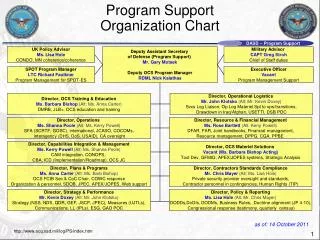
Program Assessment Chart (PAC) Instructions • Chart 6: Contracts Summary • Program Summary Contract Data: If there are more than 3 contracts applicable to the program, provide the summary information requested for all applicable contracts. • “Top 3” Contract Data: Provide the information requested for the top 3 contracts by highest ULO on the program. Contract Descriptor describes the contractual effort (e.g. LRIP III, Risk Reduction contract, FRP 10, etc) Acquisition Phase refers to the acquisition phase of the contract, (SDD, P&D, etc). • Chart 7: Subcontractors, Related Programs and Admin • Buying Command: Name of Buying Command, e.g. USAF/AFMC/ASC • PEO: Name & Phone Number of Program Executive Officer • PM: Name & Phone Number of Program Manager • CLR: Name & Phone Number of the DCMA Customer Liaison Representative • ACAT Level / Program Phase / Next Milestone: Provide the program ACAT level (e.g. I, II or III), the acquisition phase (e.g. SDD), and the next major program milestone (e.g. First Flight – MM/DD/YY). • Contractor / Cage: Name and Cage Code of Contractor • Special Requirements: Flight Safety, Navy Nuclear, etc.
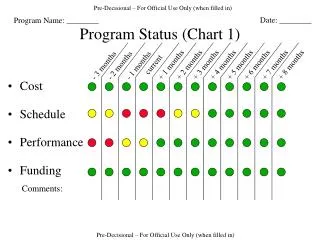
Provide a narrative mission description Provide executive level DCMA program insight Who is performing the work Provide program-specific graphics CMO Name and Commander/Director DCMA Program Assessment Chart (PAC) [Program Name] Overview (Chart 1) MM/DD/YYYY Example Pre-Decisional / For Official Use Only
[Program Name] Issues (Chart 2) Pre-Decisional / For Official Use Only
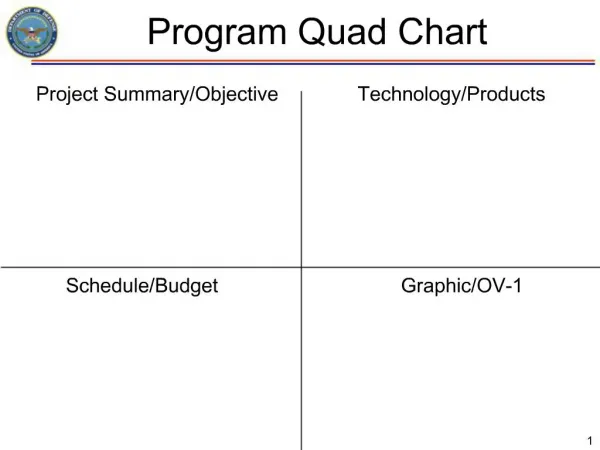
[Program Name] Quad (Chart 3) Top Cost Drivers Performance (KPPs & select KSAs) • A, % of program cost • B , % of program cost • C , % of program cost • D , % of program cost • E , % of program cost KPP 1 KPP 2 KPP 3 KSA 1 G Y G R N T O N – no capability T – Threshold O - Objective Technology Readiness Assessment Baseline Execution Index (BEI) Pre-Decisional / For Official Use Only
[Program Name]: [Contract #] (Chart 4) Contract Variance Contract Performance Example Example Include a DCMA IEAC • Current contract execution status (e.g., type of contract, percent complete, etc.) • Explanation of the Earned Value Management (EVM) data, e.g., why is it trending like it is, what WBS elements are of concern • Explanation for any significant delta between DCMA IEAC, PM EAC, and Contractor EAC • Status of recent or planned Integrated Baseline Reviews (IBRs) • Any known deficiencies in the contractor’s EVM systems Pre-Decisional / For Official Use Only
[Program Name] Risk Summary (Chart 5) 5 4 3 2 1 • Risk: • Driver: • Mitigation: • Date: • Risk: • Driver: • Mitigation: • Date: Likelihood 1 2 3 4 5 Consequence • Risk: • Driver: • Mitigation: • Date: Pre-Decisional / For Official Use Only
[Program Name]: [Contracts Summary] (Chart 6) Pre-Decisional / For Official Use Only
[Program Name]: [Subcontractors, Related Programs & Admin] (Chart 7) Pre-Decisional / For Official Use Only
Pre-Decisional-For Official Use Only XYZ RISK SUMMARY Example • PERFORMANCE • Risk: Reliability KPP will not be met at IOT&E. • Driver: Lower than expected reliability during previous OA. Design changes flowing from Design For Reliability (DFR) will not be significant enough to provide needed improvement in reliability growth potential. • Mitigation: Achieve KP-2 using SDD-2 vehicles. • Date: Jan 11 • SCHEDULE • Risk: Schedule to MS C will not be maintained. • Driver: Technical and software issues delaying Functional Integration and Acceptance testing along with a tight DTIII schedule may delay start of OA-2. • Mitigation: Providing additional resources to vehicle build and software development to recover schedule. Reviewing developmental test plans to optimize vehicle usage. • Date: Continuous • Risk has moved from 2,4 to 3,4 due to delays in Functional Integration 5 4 3 Likelihood 2 1 • COST • Risk: Redesign of the XYZ will result in increased unit costs and increased O&S costs. • Driver: Extension of development for redesign effort. Design For Reliability effort may generate cost growth over that planned. • Mitigation: Challenge contractor to meet specific development cost targets through contract incentive fee provisions. • Date: Continuous 4 1 2 3 5 Consequence • PERFORMANCE • Risk: XYZ LRIP design will not meet its weight requirement. • Driver: Reliability growth initiatives will increase weight beyond threshold requirement. Potential redefinition of Infantry load requirements will increase embarked weight. • Mitigation: Aggressive weight management throughout SDD-2 and LRIP. PM XYZ working with Design Authority on load requirements. • Date: Continuous • Risk moved from 3,4 to 2,4 due to improvements in weight margin contained in latest weight report deliverable.
Baseline Execution Index (BEI) • Baseline Execution Index (BEI): • The Baseline Execution Index (BEI) metric is used to indicate the efficiency with which actual work has been accomplished when measured against the baseline • Example: • Through August 2006 the supplier network schedule shows • 1,955 total tasks/activities to have been completed from • contract start through the current reporting period; 1,516 total tasks/activities have actually been completed • Cumulative BEI = 1,516 Actual / 1,955 Baseline = 0.78 efficiency through the current reporting period • In this example, the BEI of 0.78 falls well below 1.00 indicating a considerable portion of the program schedule is not being completed as originally planned. Through the current reporting period, the actual rate of completing 1,516 tasks/activities or 78% of all work planned indicates 22% of work planned to be completed has been deferred to future periods.
Baseline Execution Index (BEI) The BEI provides insight into the realism of program cost, resource, and schedule estimates. This TripWire is a measure of task throughput. It compares the cumulative number of tasks completed to the cumulative number of tasks baselined to be completed. It does not take into account tasks completed early or late. If the supplier completes more tasks than planned, then the BEI will be higher than 1.00 reflecting a higher task throughput than planned. • A BEI less than 0.95 trips this metric. • The BEI is always compared against the Hit Task Percentage. The Hit Task Percentage is a metric which measures the number of tasks completed early or on time to the number of tasks baselined for a given fiscal month. This metric can never exceed a value of 1, since the metric assesses the status of tasks baselined within a single fiscal month. • The BEI is calculated as follows: • Cumulative BEI = Actual total number of tasks complete • Total number of tasks baselined to complete before now[1] • Export or copy the IMS data to an Excel Worksheet. • Include the Unique ID, Task Name, EV Method, Duration, Summary[2], Actual Finish, Baseline Finish and Finish Variance fields from the IMS file. • “Total tasks”– the number of total tasks with detail level work associated to them. Filter out Level of Effort (LOE) tasks, summary tasks, and zero duration tasks (milestones). • “Baseline count”– the number of tasks baselined to finish on or before the reporting period end. Filter the Baseline Finishes data to include only dates up to the current reporting period of the IMS. • Subtotal the number of tasks as the “Baseline Count”. • Undo the filter on Baseline Finishes. • Filter the Actual Finishes data to include only dates up to the current reporting period of the IMS. • Subtotal the number of tasks as the “Actual number of tasks completed”. • Undo the filter on Actual Finishes. • Divide the “Actual number of tasks completed” by the “Baseline Count” to get the BEI value. [1]Cumulative Baseline Count [2]For ease of understanding, whenever scheduling tool terms are used, MS Project is the default terminology used. The analyst must understand his/her own scheduling tool to determine the appropriate corresponding fields.
Baseline Execution Index (BEI) • The Hit Task Percentage is calculated as follows: Current Hit Task Percentage = Actual total number of tasks completed on or before task baseline date Number of tasks baselined to complete within current reporting period[1] • Using the same spreadsheet used to calculate the BEI, clear all filters and reapply filters to remove all LOE, summary and zero duration (milestone) tasks. • Filter the baseline finish less than or equal to current reporting month end. • Subtotal these tasks as “Current Period Baseline Count” tasks. • Filter (within above filter) the actual finish less than or equal to baseline finish date. • Subtotal these tasks as “Actual Hit”. • Divide the “Actual Hit” number by the “Current Period Baseline” number to get the Current Hit Task Percentage. [1]Current period baseline count (for TripWire purposes, always a current period metric from the beginning of the month through the end of same month only)