Download
1 / 26
260 likes | 343 Views
Explore income distribution patterns, poverty thresholds, labor market impacts, government transfer programs, and more in the United States. Analyze poverty by age, race, family structure, region, and urbanization. Learn about wage trends, job loss in Ohio, and the impact of government assistance programs on poverty levels.

E N D
Distribution of Income in U.S. (2000) Group Annual Family Income Bottom 5th Under $24,000 Second 5th $24,001 - $41,000 Third 5th $41,001 - $61,378 Fourth 5th $61,379 - $91,700 Top 5th $91,701 and over (Top 5% $160,250 and over)
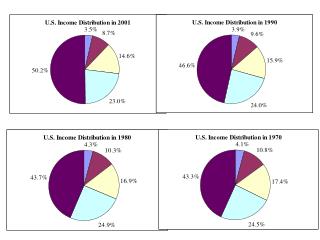
1996 1976 nominal 1976 real 1956 nom 1956 real bottom 20% 19680 7505 19824 2438 12923 second 20% 34315 12499 33015 4103 21749 third 20% 51086 17386 45924 5443 28852 fourth 20% 75316 24012 63426 7380 39119 More inequality: Rich get richer and poor get poorer? Income cut off for each group over time
What SHOULD the distribution of income look like? Three theories • Utilitarianism Maximize overall happiness Diminishing marginal utility of money • Liberalism “Veil of Ignorance” • Libertarianism No redistribution at al
The Definition of Poverty • Threshold developed in 1963-64 • Calculated money necessary for nutritionally adequate diet “designed for temporary or emergency use when funds are low” • Multiplied this amount by three • Adjusted by the size of the family, number of children, and if householder is over age 65 • Changes Over time • Adjusted for the rate of inflation (CPI)
Poverty Threshold in 2003 Under Age 65 Over Age 65 One Person $9,573 $8,825 One Adult Two Adults Two People $12,682 $12,321 Four People $18,725 $18,660 Six People $24,126 $24,586 Eight People $30,019 $30,275 Source: http://www.census.gov/hhes/poverty/threshld/thresh03.html
May Understate Poverty Work expenses Child care expenses High cost of living areas Food now less than 1/5th of American’s budgets Does not consider health status Does not consider taxes, particularly Payroll Taxes May Overstate Poverty Does not include in-kind transfers Low cost of living areas Ignores assets Problems with the Threshold
Additional Words of Caution • Poverty is an absolute measure, but we may also care about relative well-being • It is not just “in” or “out” of poverty that matters, but socioeconomic well being depends on how far below or above the poverty line a family is
Who Are The Poor? • We will examine who are the poor by: • Age • Race • Family Structure • Region • Urbanization • % of poor population vs. group poverty rate
Poverty by Age Percent of Poor Poverty Rate Source: U.S. Census Bureau; http://www.census.gov/hhes/www/poverty.html
Poverty by Race Percent of Poor Poverty Rate Source: U.S. Census Bureau; http://www.census.gov/hhes/www/poverty.html
Poverty by Family Structure Percent of Poor Families Poverty Rate Source: U.S. Census Bureau; http://www.census.gov/hhes/www/poverty.html
Poverty by Region Poverty Rate Percent of Poor Source: U.S. Census Bureau; http://www.census.gov/hhes/www/poverty.html
Poverty by Urbanization Percent of Poor Poverty Rate Source: U.S. Census Bureau; http://www.census.gov/hhes/www/poverty.html
Trends in Poverty Over Time Source: U.S. Census Bureau; http://www.census.gov/hhes/www/poverty.html
The Labor Market Impacts Poverty • The Ability To Find A Job • Unemployment • Discouraged Workers • The Quality of Jobs • Full-Time vs. Part-Time Work • Wage Rate
Ohio’s Labor Market • Ohio Was Hit Hard by the 2001 Recession • Lost 234,000 jobs (3.9%) between 2000 and 2003 • In July 2004, Ohio still had 217,000 fewer jobs than when the recession began March, 2001 • Only two other state (MI and MA) had as big or bigger % job loss as Ohio • The manufacturing sector has been declining since 1990 • from 21.7% of state’s jobs in 1990 to 15.4% in 2004 Source: Policy Matters Ohio: The State of Working Ohio
Poverty by Work Status All Families Percent of Poor Poverty Rate Source: U.S. Census Bureau; http://www.census.gov/hhes/www/poverty.html
Poverty by Work Status Families with Children Percent of Poor Poverty Rate Source: U.S. Census Bureau; http://www.census.gov/hhes/www/poverty.html
Wages in The U.S. • Median Income has fallen since 1999 from $44,922 to $43,318 in 2003 • 20.4% of jobs in the U.S. pay below the poverty threshold for a family of four Source: Working Hard, Falling Short; http://www.aecf.org/initiatives/jobsinitiative/workingpoor.htm
Wages in Ohio • Ohio’s median wage fell in 2003 to $13.14, below the national median • 19.5% of jobs in Ohio pay below the poverty threshold for a family of four Source: Working Hard, Falling Short; http://www.aecf.org/initiatives/jobsinitiative/workingpoor.htm
Program Name Target Group Number of Current Recipients Average Benefit per Recipient ($ per month) Total Annual Payments ($ billions) % of Federal Spending (Approx.) SSI: Supplemental Security Income Aged and disabled poor 7 $355 $29 1.45% TANF: Temporary Aid to Needy Families Poor families with children 6.9 $160 $22 1.10% EITC: Earned Income Tax Credit Working Poor 18.6 $120 $27 1.35% GA: General Assistance poor people not covered elsewhere 1.4 $190 $3 0.15% Total 33.9 $81 4.05% Cash Assistance Programs (2000)
Program Name Number of Current Recipients Average Benefit per Recipient ($ per month) Total Annual Payments ($ billions) % of Federal Spending (Approx.) Food Stamps 20 $92 $22 1.1% Medicaid 42 $367 $185 9.3% Housing Assistance 11 $159 $21 1.1% School lunch program 26 $26 $6 0.3% Women, Infants, and Children (WIC) 8 $31 $4 0.2% Total 107 $238 12.0% In-Kind Welfare Programs (1998)
Program Name Benefits Paid (billions) % of Federal Spending (Approx.) Social Security Old Age 334 16.7% Social Security Disability 51 2.6% Medicare 223 11.2% Unemployment Insurance 23 1.2% Workers' Compensation 52 2.6% Veterans' Benefits 42 2.1% Total 725 36.3% Major Social Insurance Programs (1999)