Download
1 / 32
320 likes | 411 Views
Analyzing water treatment plant design capacity, production rates, aging infrastructure issues, and proposed rate scenarios for financial sustainability and growth. Explore spending, debt, reserves, and customer use data to optimize operations. Prepare for potential water rationing during droughts and plan for increasing water quality challenges.

E N D
Today’s Presentation: Projects Rates Projects and Rates
WATER TREATMENT PLANT • Design Capacity 5.3 MGD • Current Daily Production 4.1 MGD • Current Daily Production 77% of Capacity • KDOW Limit = 85% Capacity 4.5 MGD • Available Capacity 400,000 Gallons per Day • At 1% Population Growth Year 8 Years to Restrictions • Design & Construction = 3 Years
Max Daily Production 95% or Greater in 7 of 11 Years • Max Daily Production 100% or 101% in 3 of 11 Years • Water Rationing Possible in Drought • Average Age of Plant: 39.6 Years • Depreciation Schedule for Plant: 15 / 20 / 40 Years • Plant is Prone to Flooding • Water Quality Increases = Plant Capacity Decreases
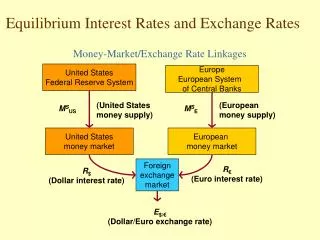
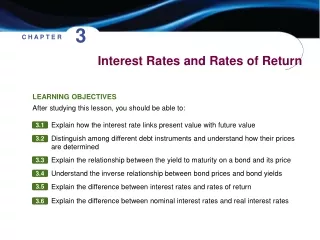
Rates • Spending: Amount and Timing • Interest and Payback Period • KIA Loan = 20 Years at 2% • Bonds = 25 Years at 6% • Reserves: 60 Day Operating Reserve
Cash Available to Pay Debt • Debt Service Ratio = • 6 Tier Rate Schedule 3 Tier Schedule Debt Payment Due
Number of Customers Use CF/Month
Total Use CF/Month Revenue ($/Year)
50 Industrial @ $0.40 $20.00 $50.00 100 gal @ $0.60 50 Residential $30.00 50 Industrial @ $0.70 $35.00 $70.00 100 gal $35.00 50 Residential @ $0.70 @ $0.70 @ $0.70 $70.00 = 1.75 = 1.17 = 1.40 @ $0.60 @ $0.40 $50.00 Industrial Increase 75% Residential Increase 17% Overall Revenue Increase 40%
SCENARIO 1 SCENARIO 2 SCENARIO 3
SCENARIO 1 SCENARIO 2 SCENARIO 3