Download
1 / 29
290 likes | 411 Views
Virtual Observatory & Grid Technique. ZHAO Yongheng (National Astronomical Observatories of China) CANS2002. Computational Science The Third Science Branch is Evolving. In the beginning science was empirical . Then theoretical branches evolved. Now, we have computational branches.

E N D
Virtual Observatory &Grid Technique ZHAO Yongheng (National Astronomical Observatories of China) CANS2002
Computational Science The Third Science Branch is Evolving • In the beginning science was empirical. • Then theoretical branches evolved. • Now, we have computational branches. • Has primarily been simulation • Growth area data analysis/visualizationof peta-scale instrument data. • Analysis & Visualization tools • Help both simulation and instruments. • Are primitive today.
Computational Science • Traditional Empirical Science • Scientist gathers data by direct observation • Scientist analyzes data • Computational Science • Data captured by instrumentsOr data generated by simulator • Processed by software • Placed in a database • Scientist analyzes database • Concern: Scalability
Astronomy Data Growth • In the “old days” astronomers took photos. • Starting in the 1960’s they began to digitize. • New instruments are digital (100s of GB/night) • Detectors are following Moore’s law. • Data avalanche: double every 2 years Total area of 3m+ telescopes in the world in m2, total number of CCD pixels in megapixel, as a function of time. Growth over 25 years is a factor of 30 in glass, 3000 in pixels. 3+ M telescopes area m^2 CCD area mpixels
Universal Access to Astronomy Data • Astronomers have a few Petabytes now. • 1 pixel (byte) / sq arc second ~ 4TB • Multi-spectral, temporal, … → 1PB • They mine it looking fornew (kinds of) objects or more of interesting ones (quasars), density variations in 400-D space correlations in 400-D space • Data doubles every 2 years. • Data is public after 2 years. • So, 50% of the data is public. • Some have private access to 5% more data. • So: 50% vs 55% access for everyone
ROSAT ~keV DSS Optical IRAS 25m 2MASS 2m GB 6cm WENSS 92cm NVSS 20cm IRAS 100m Why Astronomy Data? • It has no commercial value • No privacy concerns • Can freely share results with others • Great for experimenting with algorithms • It is real and well documented • High-dimensional data (with confidence intervals) • Spatial data • Temporal data • Many different instruments from many different places and many different times • Federation is a goal • The questions are interesting • How did the universe form? • There is a lot of it (petabytes)
Virtual Observatory== World-Wide Telescope Chandra Whipple g-ray Oak Ridge 1.2m CO MMT SIRTF Hubble VLA Sub-mm array Antartica sub-mm Magellan 6.5m
Virtual Observatory • Premise: Most data is (or could be online) • So, the Internet is the world’s best telescope: • It has data on every part of the sky • In every measured spectral band: optical, x-ray, radio.. • As deep as the best instruments (2 years ago). • It is up when you are up.The “seeing” is always great (no working at night, no clouds no moons no..). • It’s a smart telescope: links objects and data to literature on them.
Why is VO a Good Scientific Prospect? • Technological revolutions as the drivers/enablers of the bursts of scientific growth • Historical examples in astronomy: • 1960’s: the advent of electronics and access to space Quasars, CMBR, x-ray astronomy, pulsars, GRBs, … • 1980’s - 1990’s: computers, digital detectors (CCDs etc.) Galaxy formation and evolution, extrasolar planets, CMBR fluctuations, dark matter and energy, GRBs, … • 2000’s and beyond: information technology The next golden age of discovery in astronomy? VO is the mechanism to effect this process
Primary Data Providers Secondary Data Providers VO Surveys Observatories Missions Survey and Mission Archives Follow-Up Telescopes and Missions Data Services --------------- Data Mining and Analysis, Target Selection Results SDSS (USA) LAMOST (China) Digital libraries
Virtual Observatory & the Public • The universe at anyone’s fingertips • Educational activities involving real data • New discoveries made by schoolchildren • Interactive exhibits based on archived data • Astronomy as a motivator for learning about computing Real Astronomy Experience
Virtual Observatory Challenges • Size : multi-Petabyte 40,000 square degrees is 2 Trillion pixels • One band (at 1 sq arcsec) 4 Terabytes • Multi-wavelength 10-100 Terabytes • Time dimension >>10 Petabytes • Need auto parallelism tools • Unsolved MetaData problem • Hard to publish data & programs • How to federate Archives • Hard to find/understand data & programs • Current tools inadequate • new analysis & visualization tools • Data Federation is problematic • Transition to the new astronomy • Sociological issues
VO Astronomical Strategies PROBLEM SOLUTION Slow CPU growth Distributed Computing Limited storage Distributed Data Limited bandwidth Information Hierarchies - Move only what you need Data diversity Interoperability
Grids Mobile Access Supercomputer, PC-Cluster G R I D M I D D L E W A R E Desktop Data-storage, Sensors, Experiments Hoffmann, Reinefeld, Putzer Internet, networks Visualization
the Virtual Observatory concept • Aim to make all archives speak the same language • all searchable and analysable by the same tools • all data sources accessible through a uniform interface • all data held in distributed databases that appear as one archives form the Digital Sky • eventual interface to real observatories the archive is the sky
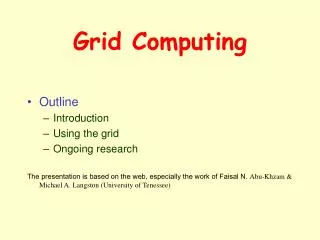
the Grid concept • shared managed distributed resources • documents + data + software + storage + cycles + expertise • network : ability to pass messages • web : transparent document system • computational grid : transparent CPU • datagrid : transparent data access and services • information grid, knowledge grid ... ? • Virtual Organisations ? a supercomputer on your desktop everybody can be a power user
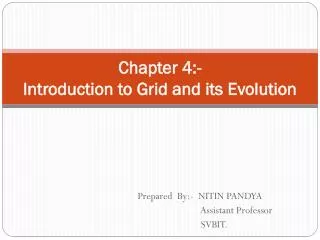
Three Layer GRID Abstraction E-Science Knowledge Grid Control Information Grid Data to Knowledge Computation/Data Grid Automation
Data Mining Algorithms Miners Scientists Science Data & Questions Database To store data Execute Queries Plumbers Question & AnswerVisualization Tools What’s needed?
obstacles to overcome • sociology • internet technology • i/o bottleneck • network bottleneck
obstacles to overcome (1) • sociology • need agreed formats for data, metadata, provenance • need standardised semantics ("ontology") • internet technology • need protocols for publishing and exchanging data • need registry for publishing service availability and semantics • need method of transmitting authentication/authorisation • need methods for managing distributed resources
obstacles to overcome (2) • i/o bottleneck • need database supercomputers • need innovative search and analysis algorithms • network bottleneck • data centers must provide analysis service • facility class analysis code needed shift the results not the data
3675440 5075 491854017 1092374 954229.737 years 1662.448 years 1.502416e+21 4.260259e+18 49.31 TFLOPs/sec Distributed Computing at Work • Virtual and collaborative exploration of the Universe Total Last 24 Hours Users Results received Total CPU time Floating Point Operations
SkyQuery Won 2nd prize in Microsoft .NET Contest
National Virtual Observatory Data Grid 1. Portals and Workbenches 2.Knowledge & Resource Management Bulk Data Analysis Metadata View Data View Catalog Analysis 3. Standard APIs and Protocols Concept space 4.Grid Security Caching Replication Backup Scheduling Information Discovery Metadata delivery Data Discovery Data Delivery 5. Standard Metadata format, Data model, Wire format 6. Catalog Mediator Data mediator Catalog/Image Specific Access Compute Resources Catalogs Data Archives Derived Collections 7.
AVO STATUS • AVO approved with EU funds ~2 Million € (total budget ~ 4M €) • Contract start on 15 November 2001 - 3 Year Phase A study • 9 NEW POSITIONS for 3 years over 6 institutions - total 18 FTE (~ 50 people) • Total VO funding AVO+NVO+ASTROGRID = $21 million (US) • 3 Year target : • Build VO 1.0 among the 6 partner archive sets by • Defining and executing trial science cases • Defining, developing and deploying new interoperability standards and tools • Developing and deploying new Grid-based services
Data-Rich Astronomy and Other Fields • Technical and methodological challenges facing the VO are common to most data-intensive sciences today, and beyond (commerce, industry, finance, etc.) • Interdisciplinary exchanges (e.g., with physics, biology, earth sciences, etc.) intellectual cross-fertilization, avoid wasteful duplication of efforts • Partnerships and collaborations with applied CS/IT are essential, may lead to significant technological advances High-energy physics WWW ! The Grid Astronomy (VO) ???
Scaling the VO Mountain Discoveries Thank you! Data Mining Visualization We are here Data Services Existing Centers and Archives