The Scientific Method
550 likes | 706 Views
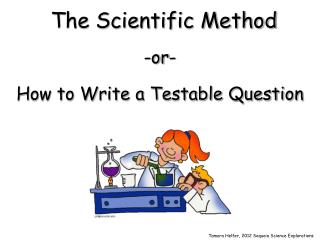
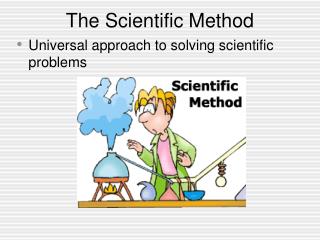
The Scientific Method. A Powerpoint Presentation By Mr. Zindman. The Scientific Method involves a series of steps that are used to investigate a natural occurrence. .

The Scientific Method
E N D
Presentation Transcript
The Scientific Method A Powerpoint Presentation By Mr. Zindman
The Scientific Method involves a series of steps that are used to investigate a natural occurrence.
We shall take a closer look at these steps and the terminology you will need to understand before you start a science experiment.
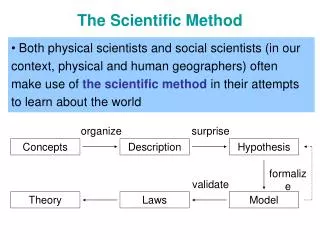
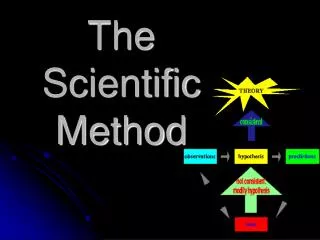
Scientific Method Here are the terms you need to know! Problem/Question Observation/Research Formulate a Hypothesis Experiment Collect and Analyze Results Conclusion Communicate the Results
I am wearing safety glasses! Steps in the Scientific Method 1.Problem/Question: Develop a question or problem that can be solved through experimentation.
Here are Examples of Some Questions: • How does salt in soil affect plant growth? • How is plant growth affected by the color of the light? • How is bacterial growth affected by temperature? • How can ultra violet cause skin cancer? • How can eating chocolate cause pimples?
2. Observation/Research:Make observations and research your topic of interest. Maybe we should go to the library to do our research?
OBSERVATION This step could also be called "research." It is the first stage in understanding the problem you have chosen. After you decide on your area of science and the specific question you want to ask, you will need to research everything that you can find about the problem. You can collect information on your topic from your own experiences, books, the internet, or even smaller "unofficial" experiments. I love to do research!
This initial research should play a big part in the experiment that you finally choose. Let's take the example of the tomatoes in the garden. You like to garden, and notice that some tomatoes are bigger than others and wonder why. Because of this personal experience and an interest in the problem, you decide to learn more about what makes plants grow.
For this stage of the Scientific Method, it's important to use as many sources as you can find. The more information you have on your topic, the better the design of your experiment is going to be! Try to get information from your teachers or librarians, or professionals who know something about your experiment’s topic. They can help to guide you to a solid experimental setup. Mr. Zindman is an excellent resource !
Predict a possible answer to the problem or question. 3. Formulate Hypothesis: Ipredict I will get an “A” in Science with hard work! Example: If soil temperatures rise, then plant growth will increase.
HYPOTHESIS The next stage of the Scientific Method is known as the "hypothesis." This word basically means "a possible solution to a problem, based on knowledge and research." The hypothesis is a simple statement that defines what you think the outcome of your experiment will be. All of the first stage of the Scientific Method -- the observation, or research stage -- is designed to help you express a problem in a single question ("Does the amount of sunlight in a garden affect tomato size?") and propose an answer to the question based on what you know. The experiment that you will design is done to test the hypothesis.
Using the example of the tomato experiment, here is an example of a hypothesis: TOPIC: "Does the amount of sunlight a tomato plant receives affect the size of the tomatoes?" HYPOTHESIS: "I believe that the more sunlight a tomato plant receives, the larger its tomatoes will grow. This hypothesis is based on: I think the amount of sunshine affects the size of a tomato, Curly! • Tomato plants need sunshine to make food through photosynthesis, and logically, more sun means more food, and; • Through informal, exploratory observations of plants in a garden, those with more sunlight appear to grow bigger.
PREDICTION The hypothesis is your general statement of how you think the scientific phenomenon in question works. Your prediction lets you get specific -- how will you demonstrate that you hypothesis is true? The experiment that you will design is done to test the prediction. An important thing to remember during this stage of the scientific method is that once you develop a hypothesis and a prediction,you shouldn't change it, even if the results of your experiment show that you were wrong. An incorrect prediction doesn't mean that you "failed." It just means that the experiment brought some new facts to light that maybe you hadn't thought about before. Continuing our tomato plant example, a good prediction would be: Increasing the amount of sunlight tomato plants in my experiment receive will cause an increase in their size compared to identical plants that received the same care but less light.
4. Experiment:Develop and follow a procedure. Do not forget your safety equipment! Include a detailed materials list. The outcome must be measurable (quantifiable). Bill Nye the Science Guy
EXPERIMENT This is the part of the scientific method that tests your hypothesis. An experiment is a tool that you design to find out if your ideas about your topic are right or wrong. It is absolutely necessary to design an experiment that will accurately test your hypothesis. I must test my hypothesis with an experiment The experiment is the most important part of the scientific method. It's the logical process that lets scientists learn about the world.
5. Collect and Analyze Results: Modify the procedure if needed. Confirm the results by retesting. Include tables, graphs, and photographs. I just love bar graphs!
6. Conclusion: Include a statement that accepts or rejects the hypothesis. Make recommendations for further study and possible improvements to the procedure. I recommend…
CONCLUSION The final step in the scientific method is the conclusion. This is a summary of the experiment's results, and how those results match up to your hypothesis. You have two options for your conclusions: based on your results, either you can reject the hypothesis, or you can not reject the hypothesis. This is an important point. You can not PROVE the hypothesis with a single experiment, because there is a chance that you made an error somewhere along the way. What you can say is that your results SUPPORT the original hypothesis.
If your original hypothesis didn't match up with the final results of your experiment, don't change the hypothesis. Instead, try to explain what might have been wrong with your original hypothesis. What information did you not have originally that caused you to be wrong in your prediction? What are the reasons that the hypothesis and experimental results didn't match up? Please make sure your experiment matches up!
7.Communicate the Results: If you are doing a science fair or class assignment be prepared to present the project to an audience. Expect questions from the audience.
Let’s put our knowledge of the Scientific Method to a realistic example that includes some of the terms you’ll be needing to use and understand.
Caution! Be careful how you use the words effectandaffect. Effectis usually a noun and affect, a verb. “ The effectof sugar amounts on the rising of bread.” “How does sugaraffectthe rising of bread?”
Problem/Question Yeast makes the bread rise! Darnell watches his mother bake bread. He ask his mother what makes the bread rise. She explains that yeast releases a gas as it feeds on sugar. This makes the bread rise.
Problem/Question Does the amount of sugar change the size of the loaf of bread? Darnell wonders if the amount of sugar used in the recipe will affect the size of the loaf of bread?
Observation/Research Darnell researches the areas of baking and fermentation and tries to come up with a way to test his question. He keeps all of his information on this topic in a journal. I do my research in the library
Darnell talks with his teacher and she gives him a Experimental Design Diagram to help him set up his investigation. Here is an Experimental Design Diagram
Formulate a Hypothesis After talking with his teacher and conducting further research, he comes up with a hypothesis. “If more sugar is added, then the bread will rise higher.”
Hypothesis The hypothesis is an educated guess about the relationship between the independent and dependent variables. Note: These variables will be defined in the next few slides.
Do you know the difference between the independent and dependent variables?
Independent Variable The independent, or manipulated variable, is a factor that’s intentionally varied by the experimenter. Darnell is going to use 25g., 50g., 100g., 250g., 500g. of sugar in his experiment.
Dependent Variable The dependent, or responding variable, is the factor that may change as a result of changes made in the independent variable. In this case, it would be the size of the loaf of bread. I would like a bigger loaf of bread!
Experiment Darnell’s teacher helps him come up with a procedureand list of needed materials. She discusses with Darnell how to determine the control group. Let me help you with your procedure, materials, and control group
Control Group In a scientific experiment, the control is the group that serves as the standard of comparison. The control group may be a “no treatment" or an “experimenter selected” group.
Control Group The control group is exposed to the same conditions as the experimental group, except for the variable being tested. I think the experiment went wrong! Next time I will use a control group. All experiments should have a control group.
Control Group Because his mother always used 50g. of sugar in her recipe, Darnell is going to use that amount in his control group.
Constants Darnell’s teacher reminds him to keep all other factors the same so that any observed changes in the bread can be attributed to the variation in the amount of sugar.
Constants Be careful to keep the constants in the experiment the same! The constants in an experiment are all the factors that the experimenter attempts to keep the same.
Constants They might include: Other ingredients to the bread recipe, oven used, rise time, brand of ingredients, cooking time, type of pan used, air temperature and humidity where the bread was rising, oven temperature, age of the yeast…
Experiment Darnell writes out his procedure for his experiment along with a materials list in his journal. He has both of these checked by his teacher where she checks for any safety concerns.
Trials Trials refer to replicate groups that are exposed to the same conditions in an experiment. Darnell is going to test each sugar variable 3 times.
Collect and Analyze Results Darnell comes up with a table he can use to record his data. Darnell gets all his materials together and carries out his experiment.
Size of Baked Bread (LxWxH) cm3 Size of Bread Loaf (cm3) Trials Control group
Collect and Analyze Results Darnell examines his data and notices that his control worked the best in this experiment, but not significantly better than 100g. of sugar.
Conclusion Darnell rejects his hypothesis, but decides to re-test using sugar amounts between 50g. and 100g.
Experiment Once again, Darnell gathers his materials and carries out his experiment. Here are the results.
Size of Baked Bread (LxWxH) cm3 Size of Bread Loaf (cm3) Trials Control group