Normal
Malignant astrocytoma. Figure S1; Soumya et al., 2009. Anaplastic astrocytoma. Normal. Glioblastoma. -3.0. 0.0. 3.0.

Normal
E N D
Presentation Transcript
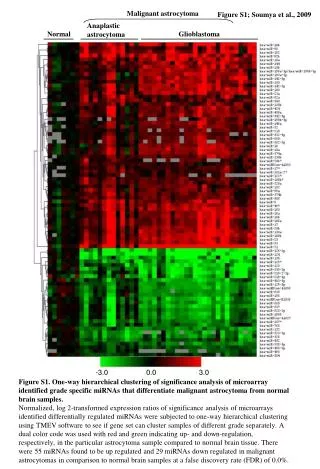
Malignant astrocytoma Figure S1; Soumya et al., 2009 Anaplastic astrocytoma Normal Glioblastoma -3.0 0.0 3.0 Figure S1. One-way hierarchical clustering of significance analysis of microarray identified grade specific miRNAs that differentiate malignant astrocytoma from normal brain samples. Normalized, log 2-transformed expression ratios of significance analysis of microarrays identified differentially regulated miRNAs were subjected to one-way hierarchical clustering using TMEV software to see if gene set can cluster samples of different grade separately. A dual color code was used with red and green indicating up- and down-regulation, respectively, in the particular astrocytoma sample compared to normal brain tissue. There were 55 miRNAs found to be up regulated and 29 miRNAs down regulated in malignant astrocytomas in comparison to normal brain samples at a false discovery rate (FDR) of 0.0%.
Figure S2; Soumya et al., 2009 A Anaplastic astrocytoma Secondary glioblastoma B Primary glioblastoma Anaplastic astrocytoma Figure S2: Identification of tumor grade specific miRNA. A and B) One-way hierarchical clustering of significance analysis of microarrays identified grade specific miRNAs that differentiate anaplastic astrocytoma and secondary glioblastoma (A) and anaplastic astrocytoma from primary glioblastoma (B). A dual color code was used with red and green indicating up- and down-regulation, respectively. -3.0 0.0 3.0
Figure S3; Soumya et al., 2009 A 6 4 2 0 Log 2 ratio -2 miR-218 -4 miR-219 -6 -8 LN229 LN18 U343 U373 U138 U251 U87 SVG -10 Glioma cell lines Normal brain B 10 8 6 4 Log 2 ratio 2 miR-21 0 miR-23a -2 LN229 LN18 U138 U251 U343 U373 U87 -4 Normal brain Glioma cell lines C 4 3 2 1 Log 2 ratio 0 -1 -2 LN229 LN18 U343 U373 U138 U251 -3 U87 SVG Normal brain Glioma cell lines miR - 25 miR - 93a D E miR - 106b 2 4 miR-16 3 1 2 0 1 -1 Log 2 ratio Log 2 ratio 0 -2 -1 U251 LN229 U251 LN18 LN229 U343 U373 U138 -2 SVG -3 LN18 U138 U87 U343 U373 SVG U87 Glioma cell lines Normal brain Normal brain Glioma cell lines miR - 155
Figure S3: A: Real time RT-PCR analysis showing the expression of miR-218 and miR-219 in control brain samples (seven) and glioma derived cell lines (eight). B: Real time RT-PCR analysis showing the expression of miR-21 and miR-23a in control brain samples (six) and glioma derived cell lines (seven). C: Real time RT-PCR analysis showing the expression of miR-25, miR-93 and miR-106b in control brain samples (seven) and glioma derived cell lines (eight). D: Real time RT-PCR analysis showing the expression of miR-155 in control brain samples (seven) and glioma derived cell lines (eight). E: Real time RT-PCR analysis showing the expression of miR-16 in control brain samples (seven) and glioma derived cell lines (eight).