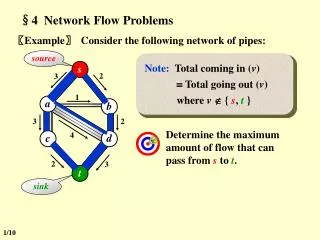
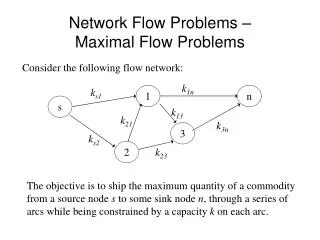
Network Flow
2. 4. 5. 2. 3. 4. 8. 6. 4. Network Flow. The diagram above shows water flowing through a pipework system. The values on the pipes are the capacities of water that they can carry. A. C. Source (S). Sink (T). B. D. 2. 4. 5. 2. 3. 4. 8. 6. 4. Network Flow.


Network Flow
E N D
Presentation Transcript
2 4 5 2 3 4 8 6 4 Network Flow The diagram above shows water flowing through a pipework system. The values on the pipes are the capacities of water that they can carry. A C Source (S) Sink (T) B D
2 4 5 2 3 4 8 6 4 Network Flow Suppose we turn on the tap so that water flows along the path SACT. What is the maximum flow along this path? The maximum flow is governed by the minimum capacity along the path – in this case 2. 2 2 A C 2 Source (S) Sink (T) B D
2 4 5 2 3 4 8 6 4 Network Flow Now consider the path SBDT. What is the maximum flow along this path? The minimum capacity along this path, and hence the maximum flow, is 4. 2 2 A C 2 Source (S) Sink (T) B D 4 4 4
2 4 5 2 3 4 8 6 4 Network Flow We can increase the flow if we can find a path from S to T with no saturated edges. The flow can then be increased by the minimum excess capacity. Consider the path SBCT . We have a total flow of 4 + 2 = 6 out of the source and into the sink. The edges AC and BD both have flows equal to their capacities. We cannot increase the flow through them and we say that they are saturated. Edges like SA and SB have a flow less than their capacity. For SA the excess capacity is 5 – 2 = 3. For SB the excess capacity is 6 – 4 = 2. The minimum excess capacity is 2, so we can increase the flow by 2. Excess capacity = 4 – 2 = 2 2 2 A C 2 Excess capacity = 3 – 0 = 3 Source (S) Sink (T) B D 4 4 4 Excess capacity = 6 – 4 = 2
2 4 5 2 3 4 8 6 4 Network Flow We can increase the flow if we can find a path from S to T with no saturated edges. The flow can then be increased by the minimum excess capacity. Consider the path SBCT . The minimum excess capacity is 2, so we can increase the flow by 2. 2 4 2 A C 2 2 Source (S) Sink (T) B D 4 6 4 4
2 4 5 2 3 4 8 6 4 Network Flow Is there another path from S to T that consists only of edges that are not saturated? Yes, the path SABCDT. What is the minimum excess capacity along this route? The minimum excess capacity is 1 along BC. We can therefore increase the flow by 1. 4 2 3 A C 2 2 3 1 1 Source (S) Sink (T) B D 6 4 5 4
2 4 5 2 3 4 8 6 4 Network Flow We now have a total flow of 9 out of the source and into the sink. Later in this section, you will look at a way of finding out whether this is the maximum flow possible. 4 3 A C 2 3 1 1 Source (S) Sink (T) B D 6 5 4