Download
1 / 33
330 likes | 567 Views
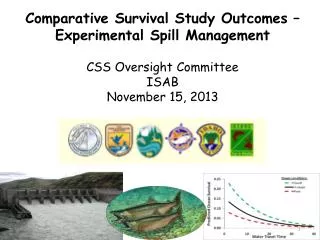
Comparative Survival Study Outcomes – Experimental Spill Management. CSS Oversight Committee ISAB November 15, 2013. Topics for today. CSS study Long term survival studies Background on spill Experimental Spill Management Design Simulation results and next steps.

E N D
Comparative Survival Study Outcomes – Experimental Spill Management CSS Oversight CommitteeISABNovember 15, 2013
Topics for today • CSS study • Long term survival studies • Background on spill • Experimental Spill Management Design • Simulation results and next steps
Comparative Survival Study • A regional collaborative salmon and steelhead life cycle monitoring program • Successfully implemented since 1998 • Annually reviewed by the NPCC Independent Scientific Advisory Board and the region • Analyses published in peer reviewed scientific journals
Background • 40- 60 years of historical run reconstruction data • 15 years of Comparative Survival Study Data • 15 years of spill and dissolved gas data and effects on juvenile migrants • Analyzed multiple lines of evidence
NPCC Smolt-to-Adult Survival Goal- Recovery • Achieve SARs averaging 4% for Snake River Chinook salmon and steelhead SAR
NPCC Smolt-to-Adult Survival Goal- Recovery • Achieve SARs averaging 4% for Snake River Chinook salmon and steelhead SAR
NPCC Smolt-to-Adult Survival Goal- Recovery • Achieve SARs averaging 4% for Snake River Chinook salmon and steelhead SAR
Decline in Snake R. Chinook & steelhead associated with dams… 3 4 5 6 7 8 dams
Key Concepts:Is there evidence linking estuary and early-ocean mortality to the migration experience through the hydrosystem? • DELAYED Hydrosystem MORTALITY • Similar concept to smoking/lung cancer Potentially 8 Dams
Approach Weight of evidence Multiple lines of evidence for relative importance of major factors influencing survival rates Life stage Precision & Specificity Life cycle Environmental Contrast
Key Studies • Petrosky and Schaller 2010 • Spill, water velocity and ocean conditions influence SARs • Haeseker et al. 2012 • Spill, water velocity and ocean conditions influence SARs • Schaller et al. in press • Spill, water velocity and ocean conditions influence Recruits/Spawner and SARs • Over a dozen peer reviewed publications
Relative Variable Importance Steelhead SAR Chinook SAR
Relative Variable Importance Steelhead SAR - - - + + Chinook SAR - + - - +
Delayed Hydrosystem Mortality • Multiple lines of evidence- • 3 fold decline in marine survival rate for Chinook • 2 fold decline in marine survival rate for Steelhead • CSS Workshop 2011 • “The evidence presented for … delayed mortality arising from earlier experience in the hydrosystem is strong and convincing.” • “ It is difficult to imagine how [other factors] would align so well both in time and space with the establishment of the hydro system.”
Summary of 2011 Workshop • Survival (in freshwater and marine) increases: • faster water velocity • increased spill • lower % transported • Current FCRPS configuration: • Little ability to speed water velocity • Opportunity to further manage spill combined with surface passage to reduce powerhouse passages • Promising approach- management experiment to evaluate improvements to SARs by increasing voluntary spill- Adaptive Management approach
In-river Passage RoutesNon-powerhouse = Spill (traditional or surface spillway weirs)Powerhouse = Turbine or juvenile collection/bypass
Spill Benefits • Historic data has consistently shown a juvenile survival advantage. • Spill is a mitigation measure that can be provided in every flow year. • Spill can be provided without impact to reservoir elevations.
Risk Based Spill Program • Survival benefits of spill > potential TDG related mortality • Adaptive Management approach-supported by empirical observations: • Juvenile survival • SARs • TDG effects
Summary of GBT Samples (1995-2012) as a function of TDG 223,921 fish examined
In Preparation for 2013 Workshop • Develop estimates of the amount of water that could be spilled (spill caps) at each of the hydroprojects on the Lower Snake and Columbia rivers for the various scenarios modeled for the 2013 workshop. • Choose representative flow years for prospective modeling.
Summary of 2013 Workshop • Reviewed historical dissolved gas effects • Characterized spill incorporating surface passage • Presented and reviewed draft Experimental Spill Management Design. • Evaluated four spill levels: • Biological Opinion-current • 115/120% - lowest increase • 120% Tailrace -moderate increase • 125% Tailrace - greatest increase
What is experimental design? • Plan for measuring response to a treatment • Treatment = increase in spill for fish passage • Response = change in survival • Plan = implement CSS monitoring methods
Elements of “good” experimental design • Large contrast (perturbation) • High precision of measured response variable • High degree of replication • Minimize and account for confounding factors
Summary of 2013 Workshop • Applied peer-reviewed models to spill levels
Prospective tools –integrating across river and ocean conditions • Summarize distributions relative to desired goals (e.g., population viability) Undesirable
Prospective tools – integrating across river and ocean conditions • Summarize distributions relative to desired goals (e.g., NPCC SAR goals, Recovery) Desirable
Chinook- Undesirable (< 1% SARS) Since ‘98: 65% 60% Probability Spill Treatment
Chinook- Desirable (> 2% SARS) Probability Since ‘98: 10% 14% Spill Treatment
Summary of 2013Workshop • Applied peer-reviewed models to spill levels
Summary of 2013Workshop • Applied peer-reviewed models to spill levels Chinook salmon Steelhead SAR
Summary: • Definition of spill scenarios for simulations based on what appears technically possible with current FCRPS configuration • Biological Planning tool indicates 125% spill level most likely to achieve SAR objectives • Ongoing CSS analyses provide rigorous monitoring framework to evaluate Experimental Spill Management • Expected benefits to Upper- & Mid-Columbia stocks • These stocks provide for additional monitoring/learning • Simulations are encouraging in terms of: • expected response (conservation benefit) • likelihood of detecting response (learning)