Expanding Computer Science Education and Job Opportunities in California
The demand for computer science professionals is on the rise, with projections indicating that the field will generate more job growth through 2018 than all other STEM areas combined. California alone is expected to have over 20,000 job openings annually in computing for the next five years. However, challenges exist in attracting diverse groups such as women and racial minorities into computer science fields. New initiatives like Exploring CS and CS Principles are designed to enhance K-12 computer science education, aiming to engage more students from varied backgrounds.

Expanding Computer Science Education and Job Opportunities in California
E N D
Presentation Transcript
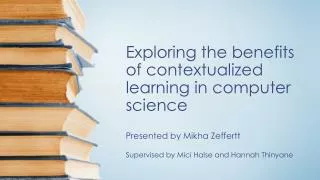
Exploring Computer Science Dan Lewis, Santa Clara UniversitySangeetaBhatnagar, Evergreen Valley HSEric Snow, SRI International
Employment Projections 60% Computer Science will generate more job growth between now and 2018 than all other STEM fields combined. Californiawill have an average of more than 20,000 job openings in computing each year for the next five years. Source: http://www.ncwit.org/caucus.php?id=CA 13.4% 5.6% 3.1% Source: U.S. Department of Labor Bureau of Labor Statistics, 2008.
Openings vs. Graduates • 1.4 million Number of computer specialist job openings expected in U.S. by 2018 29% Percentage of these that could possibly be filled by U.S. computing graduates Source: NCWIT (2009). Women and Information Technology By the Numbers
Source: ACT Research, The Condition of Career and College Readiness: 2012
National Enrollments 10.3% missing women • HS students who enroll in an Intro CS class • HS students who enroll in AP CS class (offered in less than 10% of schools) • Failing to attract women, racial minorities and the economically disadvantaged. 7.6% 32% women 68% men missing women 3.5% 2.1% 17% women 83% men Source: http://csta.acm.org/Research/sub/Projects/ResearchFiles/CSTASurvey07CSDCResults.pdf
California Enrollments Source: Compiled by Lloyd McCabe of CDE based on Data Quest data
2011 California AP Test Takers California has one of the lowest CS AP participation rates among all U.S. high school students Source: http://www.collegeboard.com/student/testing/ap/exgrd_sum/2011.html
AP Test Takers: CS as % of Math Dallas, Texas 26% Silicon Valley 10% Source: http://www.ncwit.org/work.campaigns.cse.html
New CS Curricula Exploring CS http://exploringcs.org • Entry level course • Prerequisite: Algebra I • Funded by NSF • 1st taught in LAUSD 2009-10 CS Principles http://csprinciples.org • Second level course • Funded by NSF • 1st Piloted in 2010-11 • Designed to be AP course • Supported by College Board CSTA K-12 CS Curriculum Standards http://csta.acm.org/Curriculum/sub/K12Standards.html
ESUHSD Evergreen Oak Grove Santa Teresa Silver Creek Independence SJUSD San Jose Pioneer Willow Glen San Jose ECS ProjectPARTICIPATING DISTRICTS AND SCHOOLS SCUSD • Wilcox • Santa Clara 2011-12 2012-13 Sections Offered 11 14 Students Enrolled 283 360 (projected)