1 / 1

Trauma Deaths Distribution by Age, Length of Stay, and Injury Severity Score

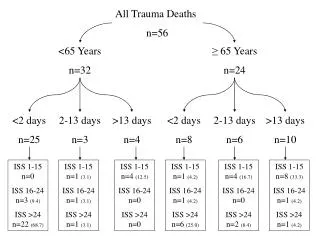
Analysis of trauma deaths in 56 individuals, categorized by age groups (<65 years and ≥65 years), length of hospital stay (<2 days, 2-13 days, >13 days), and Injury Severity Score (ISS) ranges. The study examines the distribution of deaths across these parameters.

Download Presentation

Trauma Deaths Distribution by Age, Length of Stay, and Injury Severity Score

An Image/Link below is provided (as is) to download presentation Download Policy: Content on the Website is provided to you AS IS for your information and personal use and may not be sold / licensed / shared on other websites without getting consent from its author. Content is provided to you AS IS for your information and personal use only. Download presentation by click this link. While downloading, if for some reason you are not able to download a presentation, the publisher may have deleted the file from their server. During download, if you can't get a presentation, the file might be deleted by the publisher.

E N D

Presentation Transcript


  1. All Trauma Deaths n=56 <65 Years n=32 ≥ 65 Years n=24 <2 days n=25 2-13 days n=3 >13 days n=4 <2 days n=8 2-13 days n=6 >13 days n=10 ISS 1-15 n=0 ISS 16-24 n=3 (9.4) ISS >24 n=22 (68.7) ISS 1-15 n=1 (3.1) ISS 16-24 n=1 (3.1) ISS >24 n=1 (3.1) ISS 1-15 n=4 (12.5) ISS 16-24 n=0 ISS >24 n=0 ISS 1-15 n=1 (4.2) ISS 16-24 n=1 (4.2) ISS >24 n=6 (25.0) ISS 1-15 n=4 (16.7) ISS 16-24 n=0 ISS >24 n=2 (8.4) ISS 1-15 n=8 (33.3) ISS 16-24 n=1 (4.2) ISS >24 n=1 (4.2)

More Related