Download

1 / 29
290 likes | 402 Views
VALUE OF ELECTRICAL HEAT BOILERS AND HEAT PUMPS FOR WIND POWER INTEGRATION. Peter Meibom, Juha Kiviluoma, Rüdiger Barth, Heike Brand, Christoph Weber, Helge Larsen EWEC 2006, Athens.

E N D
VALUE OF ELECTRICAL HEAT BOILERS AND HEAT PUMPS FOR WIND POWER INTEGRATION Peter Meibom, Juha Kiviluoma, Rüdiger Barth, Heike Brand, Christoph Weber, Helge Larsen EWEC 2006, Athens Risø’s mission is to promote environmentally responsible technological development that creates value in the areas of energy, industrial technology and bioproduction through research, innovation and consultancy. www.risoe.dk
Overview of presentation • Objective of the study • Method used • Wilmar Planning tool • Cases analysed • Results • Conclusions
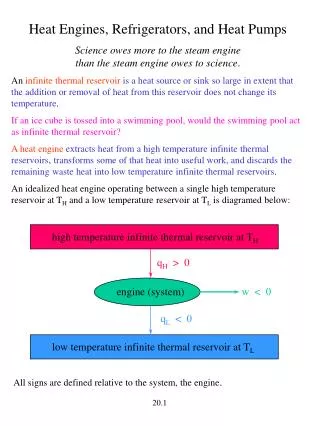
Problem setting • Problem: • Danish power system: high share of wind power & CHP • Cold winter night with high wind speeds wind power production + power production from CHP plants power demand + transmission capacity low power prices low value of wind power production • Solution: heat pumps or electrical boilers introduced in the power system
Objective of the study • Analyse the value of introducing heat pumps and electrical boilers in a power system with a high share of wind power production • Value for society (system operation costs), wind power producers (revenue), investors in heat pumps and electrical boilers (profit)
Method of the study • Model based analysis using the Wilmar Planning tool • For the Nordic countries and Germany define base power system configuration in 2010 • For three heat systems: run and compare three cases • Base case without heat measures • Heat pumps introduced in three areas (Copenhagen DK_E, Odense DK_W, Helsinki FI) • Electrical boilers introduced in three areas
Main idea behind the Planning tool • Improve decision making by using information contained in wind power production forecasts • Information: Expected wind power production, but also precision of forecast, i.e. the distribution of the wind power production forecast errors • Decisions before wind power is known: Trade on day-ahead market • Decision after wind power is known (recourse actions): Activation of regulating power
Main idea behind the Planning tool • How: • Build system-wide stochastic optimisation model with the wind power production as a stochastic input parameter • Covering both day-ahead and intraday (regulating power) market • Consequence: Model makes optimal unit dispatch on these markets that are robust towards wind power production forecast errors • Results provide lower bound on real world costs
Framework of Planning Tool • Large-scale integration of wind power in a large liberalised electricity system • Marginal costs determine unit dispatch, i.e. market power not analysed • Market structure: • Day-ahead market with hourly resolution (Elspot at Nord Pool) • Intraday market with hourly resolution (Elbas at Nord Pool + Regulating power market run by Nordic TSOs) • Market for primary (spinning)reserves with daily resolution • Heat markets with hourly resolution
2 1 3 Overview Planning Tool
Going from deterministic to stochastic optimisation • Clarify decision structure: • Time structure for new information arrival & decisions • Length of optimisation period • Number of stages (decisions) & Hours in each stage • Reoptimisation of decisions as new information becomes available (Rolling planning)
Going from deterministic to stochastic optimisation • Introduce scenario tree: • Equations node and time dependant • Minimise expected costs • Partitioning of decision variables:
12 15 18 21 00 03 00 Rolling planning Stage 1 Stage 2 Stage 3 Rolling Planning Period 1: Day- ahead market cleared Stage 1 Stage 2 Stage 3 Rolling Planning Period 2
Design Joint Market model • Objective function F= Fuel costs + Variable O&M costs + Start-up costs – Value at the end of optimisation period of heat and elec storage & hydro reservoir + CO2 Taxes – Support for renewable elec prod + Infeasibility penalties
Restrictions • Linear approximation of startup costs, partload efficiency, startup times and minimum load (C. Weber): • Introduce additional real variable ”Capacity online” • Startup costs proportional to capacity put online in time step t • Efficiency = Max_Eff*Elec_Prod + PartLoad_Eff_Factor*Cap_Online
Restrictions Start-up times: • Decision about bringing capacity online has to be done before observing wind power production scenario Capacity online constant over the first LEADTIME hours of the wind power production scenarios • Capacity online in planning loop n in the first LEADTIME hours equal to capacity online found in planning loop n-1 in the corresponding hours
Dispatch of unit group Available capacity Capacity online Capacity reserved as primary positive reserve Capacity reserved as secondary positive reserve Realised production (Prod day ahead + Up regulation – Down regulation) Minimum production (= Minimum load factor * Capacity online)
Overview of analysed cases (1) • Covers Denmark, Finland, Germany, Norway and Sweden • Considered time period: 4-28 February 2010 • Time-series are based on the year 2001. • Base power system configuration for 2010: • Power plant investments decided today are included in 2010 (e.g. Finnish nuclear power) • Already announced decommissioning of power plants are included • New transmission lines: Storebælt 600 MW (Denmark East – Denmark West), Fennoskan 2 (Sweden - Finland), New line between North-western and North-eastern Germany. • For Denmark and Germany: Forecasted wind power capacities for 2015 (production cover 29% and 11% of the annual electricity demand, respectively). • For Finland, Norway and Sweden: Wind power capacities equal to cover 20% of the annual electricity demand.
Installed wind power capacity Total production 77.3 TWh, Wind power production 12.9 TWh, Share wind power 17% during the analysed 24 days in February
Overview analysed cases (2) • Introducing either heat boilers or heat pumps in three heat areas: Odense (DK_W), Copenhagen (DK_E) and Helsinki (FI) • Analysing three cases during February: • 2010_20% as reference case • 2010_20% with heat boilers • 2010_20% with heat pumps • In each heat area: • Electrical heat boilers and heat pumps have same heat production capacity. • This heat production capacity is equal to half of the heat production capacity of CHP plants in the heat area. • Electricity consumption capacity of heat measures: • Heat pumps: 736 MW, electrical heat boilers: 2002 MW • Power capacity without wind in the whole system: 200 GW
Configuration of CHP systems Heat and power capacity of heat producing units in MW Heat production capacity of each heat measure in MW
Overview of analysed case scenarios – Assumptions High fossil fuel prices scenario: CO2 emission allowance price for the medium price scenario: 17 Euro2002/MWh
Results intraday prices Duration curve of intraday prices:
Results system benefits Investment costs: 0.6 M€/MW heat for heat pump, 0.04 M€/MW heat for electrical boiler, discount rate 3% (fixed prices), economical lifetime 20 years
Results heat measure revenue Heat measures receive heat prices found in model run without heat measure. Investment costs: 0.6 M€/MW heat for heat pump, 0.04 M€/MW heat for electrical boiler, discount rate 8% (fixed prices), economical lifetime 15 years
Conclusions • Heat measures replace production on heat boilers using fuel oil and CHP plants using different fuels. • Heat pumps are used more than electrical heat boilers. • Heat measures are beneficial for wind power producers in that: • Heat measures use electricity to produce heat when power prices are low thereby increasing low power prices. • Heat measures provide regulating power thereby decreasing the penalties connected to wind power production forecast errors.
Conclusions • The revenue of wind power producers is increased from 381.0 MEuro in the base case to 388.7 MEuro (2.0%) in the case of electrical boilers and to 390.8 MEuro (2.6%) in the case of heat pumps. • Heat measures decrease the operational costs of the power system. • The reduction in operational costs is probably enough to cover the annualised investment costs of heat pumps in DK_E and electrical boilers in DK_E and DK_W , i.e. these measures increase social welfare, but extension of analysis to a full year is needed. • Change in heat prices (marginal heat production costs) between base case and heat measure cases lower in Finnish system than in Denmark West and Denmark East: investments in heat measures not profitable in Finnish system.
The future • Extending the analysis to a whole year • Continued model development • Continued analysis of the integration costs of wind power and the performance of integration measures • Public models and documentation put on the Wilmar homepage: www.wilmar.risoe.dk • New EU project: SUPWIND • Other projects