Download
1 / 11
110 likes | 233 Views
Abyssal Current Steering of Upper Ocean Current Pathways in an Ocean Model with High Vertical Resolution. by. 1 Harley E. Hurlburt, 1 E. Joseph Metzger, 1 Patrick J. Hogan, 2 Charles E. Tilburg and 1 Jay F. Shriver 1 Naval Research Laboratory Oceanography Division

E N D
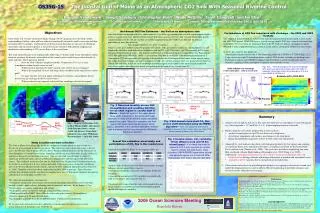
Abyssal Current Steering of Upper Ocean Current Pathways in an Ocean Model with High Vertical Resolution by 1Harley E. Hurlburt, 1E. Joseph Metzger, 1Patrick J. Hogan, 2Charles E. Tilburg and 1Jay F. Shriver 1Naval Research Laboratory Oceanography Division Stennis Space Center, MS USA 2University of New England Biddeford, ME USA Ocean Sciences Meeting Orlando, FL 3-7 Mar 2008
A=100 m2/s A=300 m2/s Kuroshio Pathway East of Japan Impact of topography and model resolution 1/8 6-layer with realistic bottom topography A=100 m2/s 1/8 6-layer flat bottom 1/4 6-layer with realistic bottom topography Model mean sea surface height forced by Hellerman and Rosenstein (1983, JPO) wind stress climatology From Hurlburt et al. (1996, JGR-O; 1997, Intl WOCE Newsletter)
Upper Ocean – Topographic Coupling in the Kuroshio Extension 1/12, 20-Layer Pacific HYCOM vs. 1/8 6-Layer NLOM Mean SSH, RMS SSH, and mean abyssal currents Mean abyssal currents and bottom topography HYCOM HYCOM NLOM NLOM (in cm) depth (in m) Adapted from Hurlburt et al. (2006; DAO submitted) and Hurlburt et al. (1996; JGR-O)
Global ocean depths between 200 m and 1500 m Only 6.5% of the seafloor lies in the depth range 200-1500 m
Mean Sea Surface Temperature Around New Zealand - Uddstrom and Oien, JGR (1999)
Mean Currents and Sea Surface Height Simulated by (A,B) 1/16 Linear Barotropic Model and (c) the Surface Layer from 1/8, 6-Layer Flat Bottom NLOM (in cm) A 21 11 1 -9 -19 -29 B -39 -49 -59 -69 -79 C (A) QuikSCAT-corrected ECMWF ERA-40 climatological wind forcing (B,C) Smoothed Hellerman and Rosenstein (1983) wind stress forcing
1/8, 6-Layer NLOM Simulation of Mean Surface and Abyssal Currents East of South Island, New Zealand Mean currents over bottom topography Mean abyssal currents over bottom topography Smoothed Hellerman and Rosenstein (1983) (HRSM) wind forcing Mean subtropical front (STF) Mean subantarctic front (SAF) From Tilburg et al. (2002; JPO)
Mean currents simulated by 1/12, 32-layer global HYCOM in the New Zealand region overlaid on seafloor depth 8.6 m depth ~ 2000 m depth Chatham Rise South Island, NZ Campbell Plateau ~ 400 m depth Southland Current transports Observed steric = 8.3 Sv (Sutton, 2003; NZJMFR) HYCOM steric = 9.0 Sv HYCOM nonsteric = 13.2 Sv HYCOM total = 22.2 Sv Location of Southland Current transport section on upper left panel From Hurlburt et al. (2006, DAO submitted)
Mean sea surface height in the New Zealand region 42S 46S 50S 54S Observation based Maximenko and Niiler (2005) 1/12 global HYCOM 42S 46S 50S 54S 1/8 global NLOM 1/32 global NLOM 160E 170E 180 170W 170E 180 170W (in cm) -80 -40 0 40 80 Fig. 14