Download
1 / 1
10 likes | 177 Views
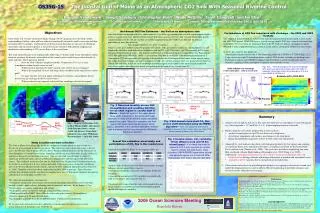
Seawater pCO 2 2004-2005. Dec 2005. ‘05 Freshet. DEEP BASIN. JEFFREY’S LEDGE. INNER. INNER. ppb. MID-SHELF. JEFFREY’S LEDGE. MID-SHELF. DEEP BASIN. ‘04 Freshet. 0. 65. Apr 2004. Cross shore distance on WB cruise (km). UNH R/V Gulf Challenger. Weiss-equilibrator.

E N D
Seawater pCO2 2004-2005 Dec 2005 ‘05 Freshet DEEP BASIN JEFFREY’S LEDGE INNER INNER ppb MID-SHELF JEFFREY’S LEDGE MID-SHELF DEEP BASIN ‘04 Freshet 0 65 Apr 2004 Cross shore distance on WB cruise (km) UNH R/V Gulf Challenger Weiss-equilibrator Fig 1 - Map of study region (left), Gulf of Maine (right), and coastal shelf divisions (lower) versus depth and distance from shore along the cross-shore Wilkinson Basin transect – a one day cruise. OS35G-15The Coastal Gulf of Maine as an Atmospheric CO2 Sink With Seasonal Riverine ControlDouglas Vandemark1, Joseph Salisbury1, Christopher Hunt1, Wade McGillis2, Janet Campbell1 and Fei Chai31University of New Hampshire 2Columbia University 3University of Maine Contact: doug.vandemark@unh.edu; (603) 862 0195 Net Annual CO2 Flux Estimates – the Gulf as an atmospheric sink One clear benefit of the repeated cross-shore transects is its utility in examining the seasonal and interannual cycles across a coastal ecosystem. Results below indicate this region acts as a net CO2 sink over our observation period. Annual estimates of the CO2 air-sea flux are readily computed using the UNH cruise data and the nominal procedure for mass flux given as: flux (mmolC/m2/day) = α* k(U) * (ΔpCO2) (1) where α is the gas solubility (a known quantity of T and S), k the gas transfer coefficient - an unknown at sea and empirically related to wind and surface turbulence, and ΔpCO2 = [pCO2airside] – [pCO2waterside], pCO2 being the gas’ partial pressure at 1 atm. The transfer coefficient k is estimated with several algorithms (e.g. Wanninkhof, 1992; Wanninkhof and McGillis, 1999) – each in terms of an hourly or ‘steady’ 10m anemometer wind speed U. Atmospheric CO2 measurements are typically collected aboard the Challenger several times within a given cruise day, while waterside estimates are made continuously with ~80 s system response time (see spatial survey figure 4). Hourly flux estimates below are derived through spatial average of each month’s data set over each predefined cross-shore regime and subsequent hourly interpolation of the terms in eq. 1 (aside from U). • Objectives • Goals of the U.S. Ocean Carbon and Climate Change (OCCC) program are to develop a robust understanding of where, when and how carbon is transferred between the earth’s reservoirs and then to monitor these exchanges. Carbon fluxes at the land-ocean boundary are one area of substantial uncertainty and our research project is focused on issues related to both optimal sampling and mechanistic understanding of CO2 air-sea fluxes in the coastal zone. • This work represents part of an ongoing study addressing several key land-ocean-atmosphere carbon transport questions by intensive observation of the coastal ocean’s surface layer carbon dioxide in space and time. These questions include: • Does the Gulf of Maine (temperate latitude, Northeastern U.S.) act as a net atmospheric carbon dioxide source or sink? • Which controls dominate the Gulf’s annual cycle of CO2 air-sea exchange? • What is the magnitude of cross and along-shore variability in the surface layer carbon pool? • Do large episodic terrestrial inputs of freshwater, nutrients, and carbonate species alter air-sea gas exchange in these coastal waters? • What are the relevant temporal and spatial flux sampling scales for this region? • Perturbations of CO2 flux associated with discharge – the 2004 and 2005 freshets • One empirical demonstration of surface water carbon flux perturbation in our region is seen across the 2004-2005 period. While 2004 was a year of average runoff, 2005 was a year of extremely high (sometimes 100 year) levels of freshwater flow to the W. Gulf (see below). A companion poster #OS46K-8 looks at phys/bio/chemical controls on the surface carbon pool attributed to these events. • In a CO2 flux context, key points are: • Annual flux estimates increase by > 30% depending solely on 5-7/2004 vs.5-7/2005 (Figs 2,3,5) • Large surface layer pCO2 drawdown occurs with the 2005 freshet, extending to the deep basin • Preliminary analysis (see OS46K-8) suggests this drawdown is mostly productivity driven • Monthly sampling is likely inadequate to quantify these episodic events Figs. 5a,b - River discharge for W. Gulf freshet periods (left) and cruise-observed surface water CO2 (right) in Hovmuller format from shore to the deep basin in X and from 4/2005 to 12/2005 in Y. USGS G.Maine river discharge 5 river summation 2005 a record year Fig. 2 Observed monthly air-sea CO2 disequilibrium and resulting CO2 flux versus shelf regime in coastal Gulf of Maine - Seasonal cycles in the upper panels show under saturation in the spring and super saturation in early winter with the largest variability nearest the coast. Mass flux estimates and their annual net value (lower panels above) follow ΔpCO2 dynamics in this monthly estimation method with the lowest net flux occurring at the Wilkinson Basin end member. Flo-thru oxygen, IOPs and CTD • Summary • Annual cycles of pCO2 and air-sea flux show the shelf to be an atmospheric C sink with annual avg. flux magnitude = -0.7 molC/m2 (+-0.4) [undersampling error not estimated] • Results along the cross-shore gradient (Fig 2 and 3) indicate - • similar seasonal pattern in ΔpCO2 near shore out to deep basin • elevated net atmospheric sink inshore, near balance in the deep basin • higher disequilibrium magnitudes inshore in both source and sink periods • Annual pCO2 cycle indicates drawdown with biological productivity (late spring) and a mixing or respiration-driven over saturation (fall-winter); resembling somewhat the data from North Sea’s southern coast (Thomas et al., 2004). This cycle does not follow neighboring east coast Mid- and South- Atlantic Bight findings (Degrandpre et al., 2002; Wang et al., 2005). Additionally, substantial perturbations are observed due to land-ocean boundary effects of: • freshwater flux driving carbonate and biological dynamics at monthly and interannual scales • atmospheric pCO2 variations due to continental air shed advection • Observations and analyses in spatial/temporal dynamics are ongoing to characterize, bound, and model the dominant processes and to address effective monitoring of metabolic dynamics and air-sea mass flux along the ocean margins. CO2 Analyzer Fig. 3 Net annual cross-shelf CO2 flux across shelf estimated using the WM92 algorithm – Note: the substantial difference in magnitude compared to Fig. 2 comes from use of the 2005 freshet season in place of the 2004 season. Fig. 4 Coastal atmos. CO2 variability 10 km offshore (red) and 15 km inland (gray) – it is clearly important to measure CO2 in both sea and air surface layers to obtain accurate fluxes. Data (courtesy UNH/AIRMAP) below show diurnal and episodic signals out to sea that differ dramatically from higher-altitude flask data. • Annual flux estimates, uncertainty, and perturbations of CO2 flux in the coastal zone • Annually averaged CO2 fluxes for the regimes above are: • Analyses indicate that at least two land-ocean factors strongly influence our net annual flux estimates - • interannual variability associated with episodic freshwater discharge • atmospheric marine layer CO2 variability associated with land-to-sea airmass advection (see Fig. 4) • Uncertainty also comes from the more well-recognized issues of gas transfer rate models and unresolved (undersampled) spatial and temporal variability • Study Location and data collection – • The Gulf of Maine is a biologically productive temperate latitude inland sea that is home to a diverse set of coastal and deepwater provinces. This study uses cross-shore cruise data collected across the Western Gulf of Maine (left box above, Wilkinson Basin Transect) by the University of New Hampshire’s Coastal Ocean Center. Sampling enfolds our near shore shelf, a ledge (Jeffrey’s), and then a deepwater end member to the east. This western Gulf coastal biome is subject to significant freshwater inputs each year during the spring freshet and then again with fall-winter storms. The combined freshwater flux into the Gulf from New England and Canadian watersheds rivals that of any Eastern U.S. river system and much of this water passes along this coastline as part of the Western Maine Coastal Current; a persistent flow enhanced during the freshet (Geyer et al. 2004). Monthly cruises have been conducted from May 2004 to present. Data collection includes flow through, profiler, and discrete sampling for a suite of biological, chemical, bio-optical and physical oceanographic variables (see http://www.cooa.unh/edu ). • The subset of measurements used here are: • Continuous along-track surface layer carbon dioxide partial pressure pCO2 (via fast-rate flow through system – photos above) including surface barometric pressure. Intake depth = 0.7 m. • Surface layer sea surface temperature and salinity • Atmospheric pCO2 via the flow through system and other stations (http://www.airmap.unh.edu) • Wind speed from the NDBC Isles of Shoals station along the transect (10 km offshore) • discrete sampling of TA and pH with depth • ancillary physical fields from the GoMPOM model, USGS river discharge data • To see more data and analyses on the carbonate system dynamics for these cruises see the associated poster of Salisbury et al. #OS46K-08. References DeGrandpre, M.D., G.J. Olbu, C.M. Beatty, and T.R. Hammar, Air-sea CO2 fluxes on the U.S. Middle Atlantic Bight, Deep-Sea Research Part II-Topical Studies in Oceanography, 49, 4355-4367, 2002. Thomas, H., Y. Bozec, K. Elkalay, and H.J.W. de Baar, Enhanced open ocean storage of CO2 from shelf sea pumping, Science, 304 (5673), 1005-1008, 2004. Wang, Z.A., W.J. Cai, Y.C. Wang, and H.W. Ji, The southeastern continental shelf of the United States as an atmospheric CO2 source and an exporter of inorganic carbon to the ocean, Continental Shelf Research, 25 (16), 1917-1941, 2005. Wanninkhof, R., Relationship Between Wind-Speed and Gas-Exchange Over the Ocean, Journal of Geophysical Research-Oceans, 97 (C5), 7373-7382, 1992. Wanninkhof, R., and W.R. McGillis, A cubic relationship between air-sea CO2 exchange and wind speed, Geophysical Research Letters, 26 (13), 1889-1892, 1999. Acknowledgments Thanks to all members of the R/V Challenger data collection team and to UNH/AIRMAP for atmospheric time series data. This work was supported in part by the NOAA Coastal Services Center through an award to the UNH Center for Coastal Ocean Observation and Analysis (COOA); NOAA award NA16OC2740, and by NASA’s Earth Science Division - Physical Oceanography Office. 2006 Ocean Sciences Meeting Honolulu Hawaii