Download
1 / 29
300 likes | 482 Views
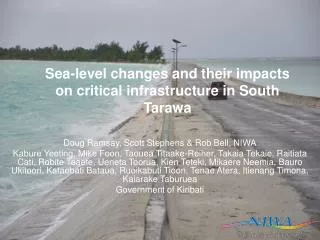
Sea-level changes and their impacts on critical infrastructure in South Tarawa. Doug Ramsay, Scott Stephens & Rob Bell, NIWA

E N D
Sea-level changes and their impacts on critical infrastructure in South Tarawa Doug Ramsay, Scott Stephens & Rob Bell, NIWA Kabure Yeeting, Mike Foon, Taouea Titaake-Reiher, Takaia Tekaie, Raitiata Cati, Robite Teaete, Ueneta Toorua, Kien Teteki, Mikaere Neemia, Bauro Ukitoori, Kataebati Bataua, Ruoikabuti Tioon, Tenae Atera, Itienang Timona, Kaiarake Taburuea Government of Kiribati
Coastal infrastructure and adaptation • Long lifetime of infrastructure investments • Robustness of present infrastructure highly variable • incomplete or outdated climate information used in design • A seeming desire to build critical infrastructure in exposed or dangerous locations. • Construction industry, building codes and standards non-existent and if available don’t incorporate climate change • Kiribati Adaption Project Phase II: Climate Information for risk management • Aimed to develop climate risk information to be adopted as national standards for option assessment and technical design (“climate-proofing” parameters)
Climate information for risk management • Coastal component: • Analysis of sea-level data and derivation of extreme water levels in Tarawa lagoon (10%, 2%, 1% AEP’s). • Extreme wave conditions on ocean and Tarawa lagoon shorelines • Joint occurrence of extreme waves and water levels around Tarawa lagoon shoreline • Wave run-up and overtopping on different types of shoreline. • How these parameters may change by 2025, 2050 and 2100 for different emission scenarios.
Data, tools & methodology • NOAA/NCEP Wavewatch III dataset • Kiribati Met Service: wind & sea level pressure dataset (1978-present) • SEAFRAME / UH tide gauge record (1974 – present) • Hydrodynamic model of Tarawa lagoon • SWAN wave model of Tarawa lagoon
Joint occurrence of waves & water levels Low probability High Probability
Joint occurrence of waves & water levels X X X + 0.48 m + 0.79 m Present Day
Coastal calculator • Acts as a database • Extreme offshore significant wave heights around each island in Kiribati and at 23 locations around the Tarawa lagoon shoreline • Extreme storm tide levels at 23 locations around the Tarawa Lagoon shoreline and representative of Tarawa ocean shoreline. • Joint occurrence of extreme wave heights AND storm tide levels at 23 locations around Tarawa lagoon shoreline (and off the east, south and west Tarawa ocean coasts) • Annual Mean Level of the Sea (MLOS) data from the University of Hawaii and SEAFRAME tide gauges from 1974 to present (updated to December 2009). • 5%, central estimates and 95% range of sea-level rise for the six emission scenarios used by the IPCC AR4 and allowance for additional ice sheet discharge based on IPCC AR4 guidance.
Coastal calculator (ocean side) Wave overtopping Effect of beach rock outcrops Wave run-up Wave height at the shoreline Wave translation Wave set-up Wave breaking X Database of extreme wave & water levels
Coastal Calculator Applications • Climate proofing land and development planning : • Assessing areas at potential risk from inundation (both in terms of frequent events, e.g. high tides, to less frequent storm-related events) and how these may change. • Setting minimum ground levels or floor levels for development activities. • Establishing the extent of existing building inundation risk and how this may change in the future. • Coastal engineering: • Deriving seawall design wave / water level conditions that account for climate change effects. • Assessing adequacy of the design of seawall permit applications. • Basic seawall profile design optimisation (to optimise performance in reducing wave overtopping) • Basic assessments of how overtopping of existing seawall structures may change and how these relate to dangerous overtopping limits
How much higher does the causeway need to be to maintain the present level of overtopping performance?
Tarawa datum issues Assumes that University of Hawaii Datum ≠ SEAFRAME Gauge datum (0.42 m difference)
Informing climate-proofed infrastructure in coastal margins • Sufficient (but only just) wave & water level datasets to be able to make: • Probabilistic assessments suitable for engineering purposes. • Evidence-based information on the potential impacts of climate change on Pacific Island coastlines. • Infrastructure design in coastal margins needs to consider both waves and water levels • how they interact • and the effects of climate change on these drivers and interactions – it is so much more than just mean sea-level rise!!
What about the rest of the Pacific? • Few, easily accessible examples, where robust analysis of coastal extreme design conditions have been derived, including measures of their accuracy and uncertainty. • Less examples of where climate change impacts have been factored in to the derivation of probabilistic design conditions. • Lack of appropriate or locally relevant design standards, building codes and processes that provide guidance and processes for accommodating climate extremes, variability and change.
Lessons learned and science gaps……. • Changes in frequency of episodic events (overtopping, inundation) often of more interest than changing magnitude. • Probabilistic methodologies for extreme wave analysis that incorporate bimodal considerations. • Robust modelling approaches that can simulated the complex wave - water interactions and feedbacks across fringing reef environments • wave breaking, wave set-up, wave grouping and infragravity waves, wave reformation and transformation. • Empirical methodologies for: • wave run-up and overtopping on fringing reef shorelines • episodic event inundation zones from run-up information.