Download
1 / 16
160 likes | 337 Views
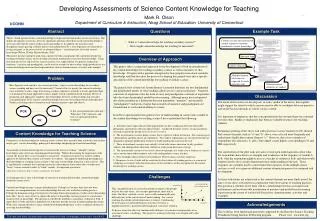
Developing Metric Assessments for Biodiversity Tenders. John Rolfe. Participants. Project run by Central Queensland University John Rolfe and Jill Windle Collaboration with Kathleen Broderick & Ingrid van Puten (GBRMPA) Romy Griener & Daniel Gregg (River Cons.)

E N D
Developing Metric Assessments for Biodiversity Tenders John Rolfe
Participants • Project run by Central Queensland University • John Rolfe and Jill Windle • Collaboration with • Kathleen Broderick & Ingrid van Puten (GBRMPA) • Romy Griener & Daniel Gregg (River Cons.) • Roy Brouwer (Vrije Universiteit Amsterdam) • Jeff Bennett (ANU) • Geoff Kerr (Lincoln NZ)
Tender mechanisms • Tenders are a form of market based instrument (MBI) • Process for auctioning public funding for biodiversity protection • Two major types • Purchasing environmental protection • BushTender • Addressing pollution issues • Water quality tender
Setting metrics • Allocations of public funding need to distinguish between different priorities • Need to assess the level of environmental improvement and compare to the bid price • Metric provides the mechanism to generate an Environmental Benefits Index • Used to rank and select bids
Missing Information • Most environmental auctions are cost-efficiency exercises • Identifying better ways to allocate public funding and gain biodiversity protection • Better to assess the economic benefits that are being generated by public funds • Need to evaluate the metric against some valuation of the environmental benefits
An example • Large water quality tender run in Burdekin catchment in north Queesland • $600K in on-ground incentives • Lower Burdekin and Haughton River catchments • Cane and grazing industries • Tender run from Sept 07 – Jan 08 • Nearly 90 bids submitted (for $2.1M) • Bids assessed using a metric
Key outputs assessed in the metric • Nutrient management • such as better nutrient budgeting and lower fertiliser application rates • Waste water management • such as recycle pits, sediment traps, drain design • Pesticide management • reductions in the application of key herbicides and pesticides • Sediment management • improved ground cover, minimum tillage, reduced stocking rates.
The metric selected: • 33 successful bids for $600,000 • 491.8 tons of sediment reduction for $89.22 per ton, • 96,207 kg nitrogen reduction for $4.55 per kg, and • 55.6 kg Pesticide reduction for $2,221 per kg. • Was the $600K of investment appropriate?
Proportion of movement • 0.04% of annual sediment load in river • 1.7% of annual Nitrogen load in river • 0.04% of annual Pesticide application in region
The project aim • Identify values from NMV experiments that can be used in tenders to evaluate bids • Estimate values for agricultural water quality improvements in GBR • Repeat the Water Quality metric with those values and compare the resulting allocations
Complications • Difficult to translate pollutants into impacts on GBR • Sediments, nutrients, pesticides • Footprint of impacts often localised • Flood plume of Burdekin River • Different pathways involved • Surface runoff versus groundwater movement • Events often episodic – major flood events
The key task • Design CM experiments relating to water quality in relevant area of GBR catchment • Translate SS, N and Pesticides into environmental outcomes • + certainty levels for the outcomes to occur • Assess WTP for the benefits of improved water quality • Have this in a form suitable for inclusion in a metric • Test against the Burdekin WQ data
Other parts to the Study • Reviewing scope for CM and benefit transfer to be used in metrics • Reviewing vegetation metrics & benefit transfer (Windle) • Reviewing existing case studies for BT in other areas • Meta analysis of values for rivers and wetlands (with Roy Brouwer) • Meta analysis of values for recreational fishing (with Geoff Kerr) • Testing in CM how benefit values are influenced by the type of input actions • E.g. shipping, green zones, Ag. Water quality