Download
1 / 9
90 likes | 363 Views
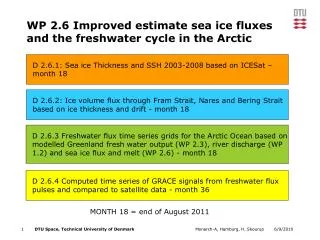
WP 2.6 Improved estimate sea ice fluxes and the freshwater cycle in the Arctic. D 2.6.1: Sea ice Thickness and SSH 2003-2008 based on ICESat – month 18. D 2.6.2: Ice volume flux through Fram Strait, Nares and Bering Strait based on ice thickness and drift - month 18.

E N D
WP 2.6 Improved estimate sea ice fluxes and the freshwater cycle in the Arctic D 2.6.1: Sea ice Thickness and SSH 2003-2008 based on ICESat – month 18 D 2.6.2: Ice volume flux through Fram Strait, Nares and Bering Strait based on ice thickness and drift - month 18 D 2.6.3 Freshwater flux time series grids for the Arctic Ocean based on modelled Greenland fresh water output (WP 2.3), river discharge (WP 1.2) and sea ice flux and melt (WP 2.6) - month 18 D 2.6.4 Computed time series of GRACE signals from freshwater flux pulses and compared to satellite data - month 36 MONTH 18 = end of August 2011
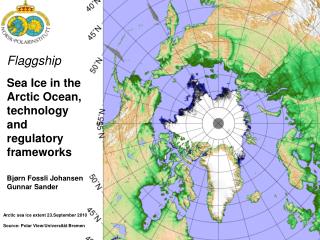
blue: February – March green: October - November Sea ice freeboard heights ICESat freeboard heights October 2005 Sea ice freeboard heights and dynamic topography of the Arctic Ocean observed from ICESat altimetry 2003-2008 release 28 are available in grids of resolution 0.1°x0.2°
Conversion of freeboard to thickness • Conversion of measured sea ice free-board heights (hf) into ice thicknesses (tice) depends on: • - Snowdepth • - Density of the ice, water and snow Recent studies suggest to use a R = 3 - 3.5 for conversion of ICESat freeboard heights into thicknesses. The study is based co-incident measurements of draft by AUV and freeboard by airborne laser Doble et al. 2011, JGR SEDNA, submitted Wadhams et al, 1992
First results of CryoSat-2 STINE results CryoSat-2
ESA CryoVEx 2011: underflight of CryoSat-2 Photo by Jóhannes Stefánsson Credits: www.esa.int/esaLP/
CryoVEx 2011: DTU Space airborne activities Austfonna Alert Charter Norlandair Twin Otter: April 7 - May 10, 2011 April 7 – 8 Installation and test flight Kangerlussuaq April 10 – 19 CryoVEx (sea ice program Alert) April 20 – 25 PROMICE (Southern Greenland) April 26 – May 6 CryoVEx (EGIG-line, Austfonna ice cap, sea ice work from RV Lance north of Svalbard, Devon ice cap) May 7 – 8 Spare/Dismount of instruments Devon EGIG-line
WP 2.6: Status and questions Lead beneficiary: DTU Space D 2.6.1: Time series grids of sea ice thickness, and improved SSH measurements, 2003-2008 (for the 3-yearly laser periods), with comparisons to selected ocean models and field-calibrated satellite data This deliverable is almost ready Lead beneficiary: NERSC D 2.6.2: Ice volume flux time series across the Fram Strait and other outlets (Bering Strait, Nares Strait) based on satellite data (2003-) To solve this we need ice thicknesses and ice drift. DTU Space has the ice thickness fields from D 2.6.1, do NERSC have ice drift ? More important who will actually calculate the flux rates, DTU Space or NERSC ?
WP 2.6: Status and questions - continued Lead beneficiary: NERSC D 2.6.3: Freshwater flux time series grids for the Arctic Ocean based on: Modeled Greenland freshwater output River discharge sea ice flux sea ice melt Who will provide the modeled freshwater output from the Greenland ice sheet ? Who will provide the river discharge ? We already have the sea ice flux from D 2.6.2 Who will provide an estimate of the sea ice melt ? Is this provided from the model of University of Hamburg ? Last but not the least we need to agree on data format and grid definitions.