Download
1 / 17
170 likes | 265 Views
This study analyzes Ozone and PM data to support regional Air Quality Index, climatology, modeling for Canada Wide Standards, cross-boundary transport assessment, and future emission projections. Includes research on regional air sheds, livestock impact, and health studies. Socio-economic analysis conducted for AQ health benefit evaluation.

E N D
Ozone and PM Data Analysis and CWS Achievement Determination S. Beauchamp, D. Waugh, C. Farrell, R. Tordon MSC-A
H L H L Ozone/PM Data Analysis • O3 and PM data support to regional AQI's • ozone/ PM climatology - e.g. episodes, diurnal, seasonal, annual trends, transport patterns June 9, 2004 18Z
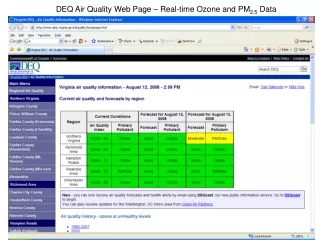
Ozone and PM Data Analysis • O3 and PM data AQ prediction model development, evaluation, application (CHRONOS, AURAMS). • continued support the AQPP forecasting and forecast verification • O3 and PM outreach: CAOL, AIRNOW.
Ozone and PM - CWS Canada Wide Standards: • data re-analyzed within the context of CWS achievement • AQ measurement linkages with KCAC and CI
Altitude (m) Ozone and PM - CWS • assessment of transboundary transport & source regions
Ozone and PM - CWS CWS AQ Modeling: • support to prov. Joint Implementation Planning • collaboration with Quebec region on AQ modeling in Eastern Canada linked with MAGS (CMC). • established new Eastern Canada grid (include offshore).
Ozone and PM - CWS CWS Modeling: • regional exceedance database. • case studies (2001-2003) selected with Que. and Atlantic (fed/prov) CWS WG. • CHRONOS model run for June 2001 base case. AQUA Modis Visible Satellite Image – 1730 UTC; June 9, 2004. Note the ‘hazy’ conditions due to the elevated particulate matter content, extending through the bottom half of the image – from Central New Brunswick and south.
Ozone and PM - CWS CWS Modeling: • AURAMS run for June 2001 base case. • Comparison of CHRONOS and AURAMS O3/PM with measured data. • CHRONOS run with no Canadian emissions (transboundary assessment).
Ozone and PM - CWS CWS Modeling Next Steps: • run CHRONOS on new grid; AURAMS next. • assess provincial contributions (CHRONOS) • model 2010 emission projections to assess CWS jurisdictional achievement. • select future year emission reduction scenarios (w/Moran)
A: Base Case - all emissions B: US Emissions only - Can off A-B diff: Canadian contribution CHRONOS CWS Modeling Case Study June 20 2001 00Z
Ozone and PM - Research 24 hr air shed - Keji Related Research: • enhanced N (Kej) • BAQS • enhanced PM • special studies: • ICARTT-TIMS • RIALTO Planned projects: • regional air sheds • NAESI
Ozone and PM - Research Beef Cattle /km2 - 1996 Planned projects: NAESI • 1) development standards and guidelines for pesticide spray application (Ernst) • 2) role of ammonia in PM formation (Vet) Livestock Manure Production -1996 N Production – Livestock Manure
Ozone and PM - Research Regional Health Studies: • QEII Health Sciences Study - respiratory/cardiac admissions and AQ (incl. pollen/spores). • CIHR Centre for Research Development - rural health strategy
Ozone and PM - Research 10% reduction in ozone and a 20% reduction in PM2.5 by 2010 Scenario #3 – used 2001 Census data, reduction in PM2.5 is reached by 2010, constant ambient concentrations between 2010-2019, and ambient data was updated based on Average of NAPS annual data 1997-1999. Socio-economic: • AQVM - AQ health cost-benefit analysis (BAQS)
Ozone and PM - Research 10% reduction in ozone and a 20% reduction in PM2.5 by 2010 Scenario #3 – used 2001 Census data, reduction in PM2.5 is reached by 2010, constant ambient concentrations between 2010-2019, and ambient data was updated based on Average of NAPS annual data 1997-1999. Socio-economic: • AQVM - AQ health cost-benefit analysis (BAQS)
SMOG R&D Summary Ozone/PM Measurement Network Ozone/PM Climatology Ozone/PM and CWS - exceedences of CWS - transboundary transport - model applications: JIP - marine emissions and regional air quality Special Studies - regional air shed - enhanced N (Keji) - RIALTO - ICARTT/TIMS - NAESI Regional Health Studies Socio-economic (AQVM)
Thank You … Keith Puckett Maris Lusis Bob Vet Dave MacTavish Jeff Brook Richard Leaitch & the ICARTT team Jan Bottenhiem Mario Benjamin Gilles Morneau Nedka Pentcheva Sylvain Menard Richard Moffet L-P Crevier Tom Dann Luc White NSDOE NBDELG Michael Hingston … and many others