Ozone and PM Analysis
440 likes | 606 Views
Progress Report for the Cooperative Agreement CX 825834 with EPA OAQPS, Year 1, 5/98 - 5/99. Ozone and PM Analysis. Prepared by: Rudolf B. Husar, PI Bret Schichtel Stefan Falke Janja Husar Submitted in June, 1999. Center for Air Pollution Impact and Trend Analysis

Ozone and PM Analysis
E N D
Presentation Transcript
Progress Report for the Cooperative Agreement CX 825834 with EPA OAQPS, Year 1, 5/98 - 5/99 Ozone and PM Analysis Prepared by: Rudolf B. Husar, PI Bret Schichtel Stefan Falke Janja Husar Submitted in June, 1999 Center for Air Pollution Impact and Trend Analysis Washington University, St. Louis, MO http://capita.wustl.edu/CAPITA/CapitaReports/CapitaActivities98-99/CAPITAActivities_98_99/
Introduction • This is a Progress Report for year 01 of the three year Cooperative Agreement (CX 825834-01, 5/01/1998-4/30/2001, $300K/yr). • The Coop is on “Ozone and PM Air Quality Analysis in Support of Public Needs” • This Report will be presented verbally at EPA to the Project Officer and other interested parties in September 1999. A web version of this presentation can be found at http://capita.wustl.edu/CAPITA/CapitaReports/CapitaActivities98-99/CAPITAActivities_98_99/ • This Progress Report has three major sections: • PM and Ozone Data Analysis • Infrastructure in Support of Air Quality Analysis • AQ Analyses in Support of AQ Management • More detailed web-based reports on specific topics are linked in the body of this Progress Report.
Contents of Progress Report • 1.0 PM and Ozone Data Analysis • 1.1 PM2.5 National Maps • 1.2 Visibility (PM2.5) trends • 1.3 Natural (out of EPA jurisdiction) Events • 1.4 US-Canada Ozone Transport • 1.5 Planned National Analyses • 2.0 Infrastructure in Support of Air Quality Analysis • 2.1 Air Quality Data Integration and the Living Data Inventory • 2.2 Air Quality Analysis Tools & Methods • 2.3 PM2.5 Analysis Website & Repository • 2.4 PM Analysis Workbook in Support of SIPS • 3.0 Air Quality Analyses Management • 3.1 AQ Management from Systems Analysis Perspective • 3.2 National-Local Interaction for Monitoring and Assessment • 3.3 Interaction among ‘Programs’ • 3.4 Megatrends
National PM2.5 Concentration Maps • PM2.5 concentration maps are useful for understanding the pollutant’s spatial pattern and identifying potential non-attainment areas of the PM2.5 NAAQS (annual average of 15 μg/m3 ) • Monitoring data provide information at specific points and are used as input in generating the maps • The limited number of PM2.5 monitoring data are inadequate to generate meaningful maps. National PM2.5 maps are generated using an enhanced inverse distance squared method that incorporates: • visibility and PM10 surrogate data to aid interpolation between PM2.5 monitors • mountain and mixing height barriers to prevent the spreading of non-representative concentrations • declustering to minimize biases from monitoring site clusters
1.1.1 Annual Average PM2.5 Concentrations (1994-96) Visibility Aided PM2.5 PM10 Aided PM2.5 [120 sites] [120 sites] [1450 sites] [380 sites] • In both maps, PM2.5 concentrations exceed 15 μg/m3 in the San Joaquin Valley and South Coast Basin of California, in the west, and Pittsburgh, St. Louis, Roanoke, and the Washington DC - New York City Metropolis. • The visibility aided estimates indicate a larger region above 15 μg/m3 along the eastern seaboard. Additional areas above 15 μg/m3 are shown with PM10 aided estimates including Atlanta and eastern Tennessee.
PM2.5 National Maps - Application • EPA Trends Report • PM2.5 Criteria Document 2000 • NAS Report
*Visibility Trends • This is an update of the US visibility trends for the period 1980-95. Earlier visibility trend reports covered the 1960 - 1992 period. • Data from 1996 and 1997 were excluded since these data were collected using the automated ASOS visibility measuring system. • The trend analysis is focused on using the summer season (June, July, August), because this is the period during which the visibility degradation is the worst over most of the US • For further information see U.S. Visibility Trends, 1960-1992
Visibility Trends 1980 - 95 Click on the images to view larger versions • In the Eastern US, throughout the 1980-95 period, the 75th percentile BEXT exceeded 0.15 or had an average visibility of less than 10 miles. • Most notable are the hazy regions on both sides of the Appalachian Mountains where the BEXT exceeds 0.2 1/km. • Since the early 1980s the BEXT decreased 10-15% with the largest decreases in the Southern and Central regions.
Light Extinction Trends of the 75th and 90th Percentiles Over the Eastern US, the 75th percentile BEXT decreased about ~8 percent over the 15 years. The largest decreases occurred in the Southeast where the BEXT decreased 12% compared to 8% in the Northeast.
Visibility Trends - Applications • Report on the Nation's Ecosystems by the Heinz Center. A White House initiative to create a ‘Report card’ on the health of our Nation’s ecosystems. • EPA National Trends Report • PM2.5 Criteria Document 2000
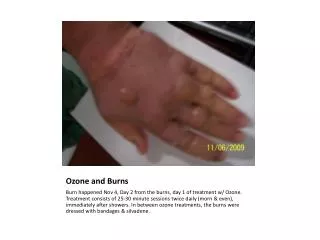
*Natural Events (Out of EPA Jurisdiction) • Dust storms and forest fires are major PM events that occur several times a year over different parts of the US. • Many of these events originate outside the US, e.g. dust from Sahara and the Asian desserts and smoke from forest fires in Central America and Canada. • Exceedances of the NAAQS caused by dust and smoke events are uncontrollable ‘acts of God’. Nevertheless, states are required to provide evidence that such events (outside their jurisdiction) have occurred. • For this reason, control agencies need to be able to detect and document the impact of such events on their control region. The existing tools for such documentation are poorly developed. • The natural PM events are illustrated by two extreme examples: Asian dust impacting on the West Coast and the Central American forest fire smoke impacting the Eastern US.
Natural Events - Results Smoke from C. American Forest Fires SeaWiFS View of the Smoke GOES 8 View of the Smoke • During a ten-day period, May 7-17, 1998, smoke from fires in Central America drifted northward into USA and Canada. • The smoke caused exceedances of the PM standard, health alerts, and impairment of air traffic, as well as major reductions of visual range. • It has been argued that some ozone exceedances in the Eastern US may have been due to ozone generated by the forest fire smoke.
Natural Events - Results Asian Dust over the West Coast • In Vancouver and in Washington State the PM10 and PM2.5 concentrations reached 100 an 40 µg respectively. • Based on public complaints and monitoring data, the State of Washington has issued a ban on open burning on April 29.
*Natural Events - Applications • Used in the assessment of the requests by States for ozone exceedance waivers for smoke generated ozone. • PM2.5 Criteria Document 2000 • Public and media information source
*US-Canada Ozone Transport • This is a preliminary analysis for the US-Canada Air Quality Agreement. • The purpose is to illustrate ozone transport across the national boundaries. • The analysis methodology included: • O3 concentration stratified by wind direction • O3 concentration stratified by wind speed • Transport wind vectors under high and low ozone conditions • For further information see Ozone Transport Over Eastern North America
Ozone Transport as a Function of Find Direction At high wind speeds, > 6 m/s, higher concentrations appear at the downwind edges of the Eastern North American domain
Transport on High and Low Ozone Days On high O3 days, the transport winds are slow with clockwise circulation around the south-center of the Eastern US.On low O3 days, swift transport winds are from outside the industrial Eastern North America. Transport winds during high (90%-ile) local ozone days. Transport winds during low (10%-ile) local ozone days.
US-Canada Ozone Transport - Applications • Canada/US Air Quality Agreement
*Planned National PM Analyses • PM Spatial and Temporal Pattern Analysis • Seasonal • Weekly • PM Transport Climatology - relate transport to ambient concentrations and vice versa. • Surface Winds • Forward Airmass Histories • Backward Airmass Histories
Infrastructure in Support of AQ Analysis • PM and Ozone Data Analysis • PM2.5 National Maps • Visibility (PM2.5) trends • Natural (out of EPA jurisdiction) Events • US-Canada Ozone Transport • Planned National Analyses • Infrastructure in Support of AQ Analysis • Air Quality Data Integration and the Living Data Inventory • Air Quality Analysis Tools & Methods • PM2.5 Analysis Website & Repository • PM Analysis Workbook in Support of SIPS • AQ Analyses in Support of AQ Management • AQ Management from Systems Analysis Perspective • National-Local Interaction for Monitoring and Assessment • Interaction among ‘Programs’ • Megatrends
*Air Quality Data Integration and Living Data Inventory The Problem • The researcher cannot get access to the data; • if he can, he cannot read them; • if he can read them, • he does not know how good they are; • and if he finds them good • he cannot merge them with other data. Information Technology and the Conduct of Research: The Users view National Academy Press, 1989 • For further information see Outline of an Open, Distributed Air Quality Data Integration and Analysis System
Infrastructure support for a distributed system • Data sharing standards.A set of open standards for the sharing of AQ data, tools and reports. Examples: TCP/IP, HTML, XML, FGDC • Data catalog. A virtual centralized catalog with search and retrieval facilities. Examples: GCMD, web-indexes • Web-based shared workspace. Place to share comments, feedback, plans, ...
Benefits of a Distributed and Shared System • Access to data. Users can get data, tools, reports out of the system for specific projects. It can be a forum for the exchange of ideas, peer-feedback etc. • Saving time and money. The data, tools and other resources in the system could be leveraging the dollars and time available for specific projects. • Recycling Data. Data are costly resource. The system can help managing, accessing and documenting one's own data, and share it with others for re-use.
*North American Integrated Fine Particle Data Sets PM2.5 mass and composition data (1979-1997) consisting of ~600 urban and rural monitoring sites in the US and Canada from 18 networks. Data sets integrated include IMPROVE, AIRS, NAPS, CASTNet, and others. See NAM Fine Particle Data Sets for further information. o Other
*North American Integrated Ozone Data Sets Daily maximum ozone for the entire U.S. (1415 sites) and Canada (167 sites) from 1986 - 1996. The data set was created by integrating ozone data from 7 networks including AIRS, NAPS and CASTNet. This is an update of the OTAG daily maximum ozone data set.
*CAPITA Tools & Methods for AQ Analysis • CAPITA has developed, used and shared a number of software tools and data analysis methods to facilitate PM data analysis. • Data visualization Tools • Voyager - a multidimensional data browser • Metbrows - A multidimensional Meteorological Data browser • Movie - animation utility • MapEdit - GIS tool • Spatial Mapping Tool • Distance weighting • Krieging • Surrogate aided, Declustering & Vertical & Horizontal barriers • CAPITA Monte Carlo Model • A diagonsitic tool for the simulation and investigation of the roles of air pollutant emissions, transport and kinetics on the air quality.
*PM2.5 Analysis Workbook in Support of SIPS • EPA's Emissions, Monitoring, and Analysis Division has initiating a collaborative effort to explore relevant analyses of the PM2.5 data to be collected by the new National and State monitoring networks . • The goals of the this collaboration are to foster an environment for the sharing of ideas and develop a workbook detailing useful analyses of the PM2.5 mass and speciated data. • The PM Analysis workbook will be used to deliver data, tools and methods relevant to State PM data analysts as well as serve as a repository for PM analysis results and knowledge. • The workbook can be found in the Workbook section of the PMfine website.
PM2.5 Analysis Workbook Outline 1. Introduction 2. Ensuring High Quality Data 3. Quantifying PM NAAQS Attainment Status 4. Characterizing Ambient PM Concentrations and Processes 5. Quantifying Trends in PM and its Precursors 6. Quantifying the Contribution of Important Sources to PM Concentrations 7. Evaluating PM and Precursor Emission Inventories 8. Identifying and Quantifying the Potential for Control Strategies in Helping Attain the Standard 9. Using PM Data to Assess Visibility
*PM Analysis Website • This website is a forum for the free exchange of fine particle data and information in support of these goals. • The virtual community that shares this website consists of individuals from the federal EPA, regional, state and local air pollution agencies, industry and other groups. • Documents related to the official regulatory process are to be found on the companion EPA PM2.5 Data Analysis website. • The PM Analysis Website is located at: http://capita.wustl.edu/PMfine/
AQ Analyses in Support of AQ Management • PM and Ozone Data Analysis • PM2.5 National Maps • Visibility (PM2.5) trends • Natural (out of EPA jurisdiction) Events • US-Canada Ozone Transport • Planned National Analyses • Air Quality Analysis Infrastructure • Air Quality Data Integration and the Living Data Inventory • Air Quality Analysis Tools & Methods • PM2.5 Analysis Website & Repository • PM Analysis Workbook in Support of SIPS • AQ Analyses in Support of AQ Management • AQ Management from Systems Analysis Perspective • National-Local Interaction for Monitoring and Assessment • Interaction among ‘Programs’ • Megatrends
AQ Management from Systems Analysis Perspective • Following the systems approach, the key AQ management steps are: • Setting of AQ Goals • Monitoring and Assessment of Status and Trends • Actions to Reduce Exceedances • Each management module is well defined • Its function is clear • Has specific information need • The role of the AQ Analyst is to provide AQ information to these modules • These steps are consistent with the current EPA practice (?)
Systems Concepts in Support of AQ Management Support • Provides an inclusive framework • Identifies the key players/stakeholders and their relationship • Indicates their information needs and flow pattern
Air Quality and Management as a Feedback System Monitoring (Sensing) AssessmentDetermine DeviationsPlan ReductionsTrack Progress Set Goals CAAA NAAQS AirQuality Implementing Reductions(Actions)
The Wheel of AQ Management (Adopted from J. Bachmann) Establish Goals Monitor AQ DetermineReductions EvaluateResults PlanReductions Analysis Modeling Implement Reductions
National and Local AQ Analysis • AQ data analysis needs to be performed at both national (global) and local levels • The ‘global’ analysis establishes the large scale context • Local analysis focuses on the specific and detailed local features • National-local interaction needs to be mutually beneficial
National-Local Information Sharing • The national and local analysts maintain their own ‘workspace’ • However, part of the workspace ( data, reports, some discussion) can be shared (exposed) • Networking can create a common virtual workspace
Potential Applications of National-Local Interaction • OAQPS-State Analyst • Supersite Program
Interaction Among Programs • Super sites, NARSTO
Megatrends Related to PM2.5 • From SO2 and TSP to Ozone and Fine Particulates • Recent health and environmental effects studies implicate ozone and fine particulates as two of the most serious current air quality problems in North America. • From Primary to Secondary Pollutants • Ozone as fine particles are not primary (emitted) but formed in the atmosphere from complex mixtures of precursor gases. There are no direct ways of identifying the impact of specific sources. • From Short Range to Long Range Impact • The atmospheric lifetime of O3 and PM2.5 is several days, so the winds carries them over 1,000 km from their source. The result is "long-range transport" across state and international boundaries. • From Command and Control to ‘Weight of Evidence” • The new AQ management style strives to include stakeholders in the policy development; encourages market-based resource allocations and applies 'weight of evidence' - to compliance management