Download
1 / 6
60 likes | 229 Views
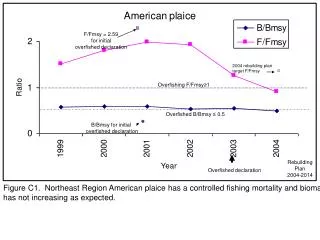
F/Fmsy = 2.59 for initial overfished declaration. 2004 rebuilding plan target F/Fmsy. Overfishing F/Fmsy ≥ 1. Overfished B/Bmsy ≤ 0.5. B/Bmsy for initial overfished declaration. Rebuilding Plan 2004-2014. Overfished declaration.

E N D
F/Fmsy = 2.59 for initial overfished declaration 2004 rebuilding plan target F/Fmsy Overfishing F/Fmsy≥1 Overfished B/Bmsy ≤ 0.5 B/Bmsy for initial overfished declaration Rebuilding Plan 2004-2014 Overfished declaration Figure C1. Northeast Region American plaice has a controlled fishing mortality and biomass has not increasing as expected.
F/Fmsy for initial overfished declaration Overfishing F/Fmsy≥1 Overfished MSST = B/Bmsy 0.6 B/Bmsy for initial overfished declaration Overfished declaration Figure C2. Highly Migratory Species bigeye tuna - Atlantic has a controlled fishing mortality but biomass is not increasing as expected. FMP not internationally implemented
Overfishing F/Fmsy≥1 Overfished B/Bmsy ≤ 0.5 Overfished Declaration Rebuilding Plan 2004-2014 Figure C3. Northeast Region ocean pout has a controlled fishing mortality but biomass has not increased as expected.Bmsy proxy is in kg/tow.
Overfishing F/Fmsy≥1 Overfished MSST = B/Bmsy .8-.9 Rebuilding Plan 2004-2029 Overfished declaration Figure C4. Highly Migratory Species sandbar shark has a controlled fishing mortality but biomass is not increasing as expected. FMP not internationally implemented
Figure C4. Northeast Region thorny skate shark has a controlled fishing mortality but biomass is not increasing as expected. Bmsy proxy is in kg/tow. *Skate stocks F/Fmsy are measured by percent change over a 3 year period.
Overfishing F/Fmsy≥1 Overfished B/Bmsy ≤ 0.5 Rebuilding Plan 2004-2014 Overfished Declaration Figure C6. Northeast Region windowpane flounder – Southern New England / Mid-Atlantic Bight has a controlled fishing mortality but biomass has not increased as expected. Bmsy proxy is in kg/tow.