Download
1 / 34
340 likes | 539 Views
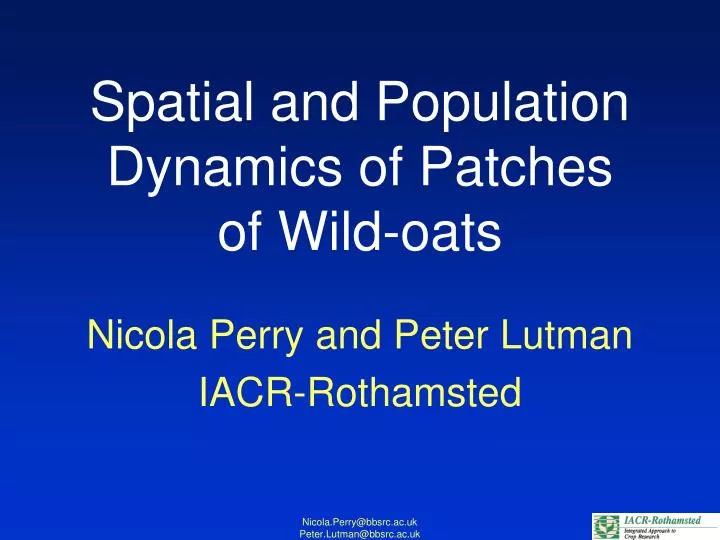
Spatial and Population Dynamics of Patches of Wild-oats. Nicola Perry and Peter Lutman IACR-Rothamsted. Background:. Wild-oats:. Important grass weed Patchy distribution Patch stability unknown. Experiment details. Patch size 3x3 m Two sowing densities: 10 plants/m 2 and 50 plants/m 2

E N D
Spatial and Population Dynamics of Patches of Wild-oats Nicola Perry and Peter Lutman IACR-Rothamsted Nicola.Perry@bbsrc.ac.uk Peter.Lutman@bbsrc.ac.uk
Background: Wild-oats: • Important grass weed • Patchy distribution • Patch stability unknown Nicola.Perry@bbsrc.ac.uk Peter.Lutman@bbsrc.ac.uk
Experiment details • Patch size 3x3 m • Two sowing densities: • 10 plants/m2 and 50 plants/m2 • Ploughing, cultivations and combining in same direction each year • +/- wild-oat herbicide in 2000 Nicola.Perry@bbsrc.ac.uk Peter.Lutman@bbsrc.ac.uk
Experiment design 12m 3m HD SHD LD SHD 3m 30m HD SLD LD SLD HD = high density; LD = low density; S = sprayed N arrows indicate cultivation & combining direction Nicola.Perry@bbsrc.ac.uk Peter.Lutman@bbsrc.ac.uk
Monitoring • Panicle distribution • Seed movement • Patch shape • Location of outliers Nicola.Perry@bbsrc.ac.uk Peter.Lutman@bbsrc.ac.uk
Panicle and seed distribution 1999 Panicles / m2 Seeds / m2 Direction of cultivation & combining Nicola.Perry@bbsrc.ac.uk Peter.Lutman@bbsrc.ac.uk
Panicle and seed distribution Sprayed Treatments 2000 Panicles / m2 Seeds / m2 Direction of cultivation & combining Nicola.Perry@bbsrc.ac.uk Peter.Lutman@bbsrc.ac.uk
Seed distribution after harvestSprayed v Unsprayed 2000 Total no. seeds/m2 Sprayed: 17,860 Unsprayed: 139,410 Direction of cultivation & combining Nicola.Perry@bbsrc.ac.uk Peter.Lutman@bbsrc.ac.uk
Low Density Sprayed Patch harvesting & cultivation 1998 (9 m2) 1999 (20.3 m2) 2000 (20.6 m2) m Nicola.Perry@bbsrc.ac.uk Peter.Lutman@bbsrc.ac.uk
High Density Unsprayed Patch harvesting & cultivation 1998 (9 m2) 1999 (29.5 m2) 2000 (41.0 m2) m Nicola.Perry@bbsrc.ac.uk Peter.Lutman@bbsrc.ac.uk
1999 Patch outline Outliers Nicola.Perry@bbsrc.ac.uk Peter.Lutman@bbsrc.ac.uk
2000 Patch outline S Outliers S S S Sprayed plots S Nicola.Perry@bbsrc.ac.uk Peter.Lutman@bbsrc.ac.uk
Conclusions • Majority of seeds move 1-2 m • movement due to cultivations and plants leaning in wind • Isolated plants occur up to 30 m away • movement by combine • may lead to future infestations / new patches Nicola.Perry@bbsrc.ac.uk Peter.Lutman@bbsrc.ac.uk
Conclusions • Wild-oats need frequent re-mapping • Patches not stable and new patches may form from isolated plants • Presence of outliers make decisions on patch spraying complicated Nicola.Perry@bbsrc.ac.uk Peter.Lutman@bbsrc.ac.uk
Limitations of manually mapping weed patches Nicola Perry and Peter Lutman IACR-Rothamsted Nicola.Perry@bbsrc.ac.uk Peter.Lutman@bbsrc.ac.uk
Methods of manually mapping weed patches • Visual detection (human) • mapping on a grid • ATV, tractor/sprayer, combine • walking around patches Nicola.Perry@bbsrc.ac.uk Peter.Lutman@bbsrc.ac.uk
Weed attributes which can be recorded • Presence / absence • Approximate levels (high / low) • Weed numbers • Weed vigour / ground cover Nicola.Perry@bbsrc.ac.uk Peter.Lutman@bbsrc.ac.uk
Weed attributes which can be recorded from a vehicle or using quadrats Nicola.Perry@bbsrc.ac.uk Peter.Lutman@bbsrc.ac.uk
Timing of visual assessments Nicola.Perry@bbsrc.ac.uk Peter.Lutman@bbsrc.ac.uk
Activities on Warren Field(winter wheat) Nicola.Perry@bbsrc.ac.uk Peter.Lutman@bbsrc.ac.uk
Warren Field black-grass comparison of mapping methods Quadrat threshold 20 plants/m2 (Dec 99) ATV (Jan 00) Correlation : 0.82 Black-grass No Black-grass Nicola.Perry@bbsrc.ac.uk Peter.Lutman@bbsrc.ac.uk
Warren Field black-grass comparison of mapping methods Quadrat threshold 5 plants/m2 (Dec 99) ATV (Jan 00) Correlation : 0.60 Black-grass No Black-grass Nicola.Perry@bbsrc.ac.uk Peter.Lutman@bbsrc.ac.uk
Warren Field black-grass comparison of mapping methods Quadrat threshold 20 plants/m2 (Dec 99) Tractor (June 00) Correlation : 0.37 Black-grass No Black-grass Nicola.Perry@bbsrc.ac.uk Peter.Lutman@bbsrc.ac.uk
Warren Field black-grass comparison of mapping methods Quadrat threshold 2 plants/m2 (Dec 99) Tractor (June 00) Correlation : 0.84 Black-grass No Black-grass Nicola.Perry@bbsrc.ac.uk Peter.Lutman@bbsrc.ac.uk
Warren Field wild-oats comparison of mapping methods Quadrat threshold 2 plants/m2 (Dec 99) ATV (Jan 00) Correlation : 0.74 Wild-oats No Wild-oats Nicola.Perry@bbsrc.ac.uk Peter.Lutman@bbsrc.ac.uk
Warren Field wild-oats comparison of mapping methods Quadrat threshold 2 plants/m2 (Dec 99) Tractor (June 00) Correlation : 0.58 Wild-oats No Wild-oats Nicola.Perry@bbsrc.ac.uk Peter.Lutman@bbsrc.ac.uk
Broad Mead black-grass comparison of mapping methods Quadrat threshold 5 plants/m2 (Dec 99) ATV (Jan 00) Correlation : 0.70 Black-grass No Black-grass Nicola.Perry@bbsrc.ac.uk Peter.Lutman@bbsrc.ac.uk
Black-grass distribution in Cashmore Field Mapped from ATV Nov 99 Mapped on foot May 00 Mapped from combine July 00 Nicola.Perry@bbsrc.ac.uk Peter.Lutman@bbsrc.ac.uk
Conclusions • Limitations to manually mapping weeds • Discrete quadrat sampling too time consuming for mapping on a whole-field scale • Continuous visual detection from a vehicle is less accurate, & may be restricted to tramlines, but is quicker Nicola.Perry@bbsrc.ac.uk Peter.Lutman@bbsrc.ac.uk
Conclusions • Need to make more progress with optimum visual detection in absence of automated detection Nicola.Perry@bbsrc.ac.uk Peter.Lutman@bbsrc.ac.uk