Download
1 / 1
10 likes | 141 Views
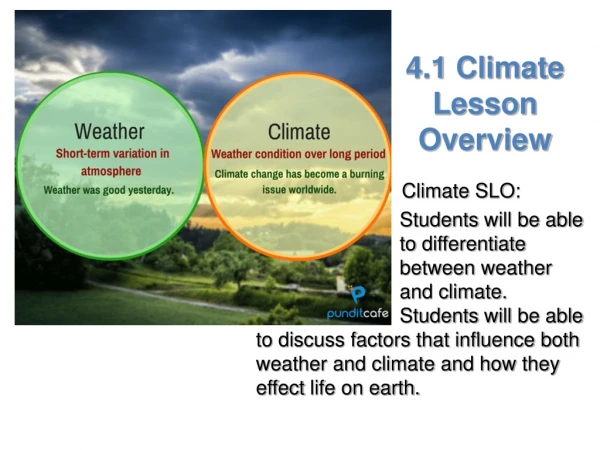
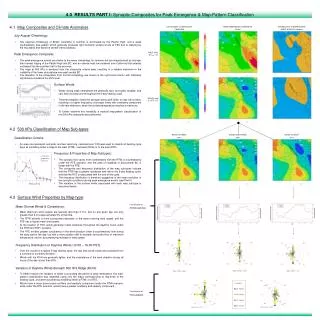
4.0 RESULTS PART I: Synoptic Composites for Peak Emergence & Map-Pattern Classification. 4.1 Map Composites and Climate Anomalies. JULY-AUGUST CLIMATOLOGY (1948-2003). PEAK EMERGENCE COMPOSITE (N=64). ANOMOLOGY & SIGNIFICANCE (MSLP & 500 hPa Heights). July-August Climatology:

E N D
4.0 RESULTS PART I: Synoptic Composites for Peak Emergence & Map-Pattern Classification 4.1 Map Composites and Climate Anomalies JULY-AUGUST CLIMATOLOGY (1948-2003) PEAK EMERGENCE COMPOSITE (N=64) ANOMOLOGY & SIGNIFICANCE (MSLP & 500 hPa Heights) • July-August Climatology: • The regional climatology of British Columbia in summer is dominated by the Pacific High, and a weak southwesterly flow pattern which generally produces light southerly surface winds at YXS due to steering by the mountains that flank the central-interior plateau. • Peak Emergence Composite: • The peak emergence events are similar to the mean climatology for summer, but are characterized by stronger than normal ridging of the Pacific High into BC, and an intense heat low centered over California that extends northward into the southern half of the province. • The ridge at 500 hPa is centered over the composite criteria area, resulting in a relative maximum in the instability of the lower atmosphere over east-central BC. • The deviation of the composites from normal climatology are shown in the right-hand column with statistical significance shaded at the 95% level. MSLP (hPa) & Tmax (oC) • Surface Winds: • Winds during peak emergence are generally light, but highly variable, and vary both diurnally and throughout the 5-day heating cycle. • Thermal instability mixes the stronger winds aloft down to near the surface, resulting in a higher frequency of stronger winds with a westerly component in the late afternoon, when the surface temperature reaches a maximum. • To further examine this variability, a manual map-pattern classification of the 500 hPa composite was performed. 500 hPa (dm) & LFTX (oC) 4.2 500 hPa Classification of Map Sub-types: RIDGE TO WEST (40%) RIDGE OVER HEAD (29%) RIDGE TO EAST (31%) • Classification Criteria: • An area one reanalysis cell wide, and two cells long, centered over YXS was used to classify all heating cycle days as exhibiting either a ridge to the west (RTW), overhead (ROH) or to the east (RTE). • Frequency & Properties of Map-Subtypes: • The synoptic flow varies from northwesterly with the RTW, to southwesterly under the RTE scenario, and the area of instability in east-central BC is larger with the RTE. • The composite and frequency distribution of the map sub-types indicate that the RTW has a greater residence time within the 5-day heating cycle, and that the RTE is associated with the end of the cycle. • The frequency distribution is therefore suggestive of the mean evolution of the synoptic conditions during peak emergence events (see Part II). • The variation of the surface winds associated with each map sub-type is described below. 4.3 Surface Wind Properties by Map-type: Classification of All Heat Cycle Days Mean Diurnal Winds & Consistency: • Mean afternoon wind speeds are typically less than 3 m/s, and on any given day, are only greater than 6 m/s approximately 5% of the time. • The RTW exhibits a more pronounced decrease in the mean evening wind speed, and the RTE has a higher mean wind speed. • At the location of YXS, winds generally rotate clockwise throughout the daytime hours under the RTW and ROH scenario. • The RTE exhibits greater consistency in the wind direction under a southwesterly flow during the early part of the day, but with a more sudden shift to westerly during the time of maximum temperature, and an accompanying increase in wind speed. Frequency Distribution of Daytime Winds (10:00 – 16:00 PST): • Over the course of a typical 5-day heating cycle, the day time winds rotate anti-clockwise from a northerly to southerly direction. • Winds with the ROH are generally lighter, and the consistency of the wind direction during all hours of the day is less than 50%. Variation of Daytime Winds Beneath 500 hPa Ridge (ROH): • To better resolve the variation of winds surrounding the period of peak emergence, the map-pattern classification was repeated using only the maps corresponding to day-three of the heating cycle, and were classified as exhibiting either a RTW, or a RTE. • Winds have a more pronounced northerly and westerly component under the RTW scenario, while under the RTE scenario, winds have a greater southerly and easterly component. Classification of Peak Composite