Download

1 / 19
200 likes | 343 Views
ANNUAL AND FINAL PERFORMANCE REPORTS. 524B FORM REPORTING PERIOD BUDGET EXPENDITURES INDIRECT COST RATE PERFORMANCE MEASURES. IMPORTANCE OF PERFORMANCE REPORTING. Reports from Project Directors are reviewed by Project Officers.

E N D
ANNUAL AND FINAL PERFORMANCE REPORTS 524B FORM REPORTING PERIOD BUDGET EXPENDITURES INDIRECT COST RATE PERFORMANCE MEASURES
IMPORTANCE OF PERFORMANCE REPORTING • Reports from Project Directors are reviewed by Project Officers. • Electronic files of individual project reports are submitted to a data base that is accessible to Department staff. • Report data are used to evaluate individual projects. • Individual project data are aggregated as a data source to inform OSEP’s annual progress report on the IDEA Part D programs for PART and GPRA. • Data needs to be clearly articulated, accurate, and timely.
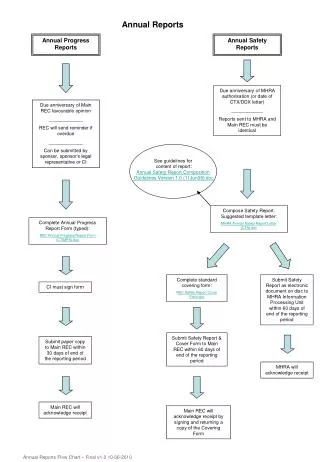
ANNUAL PERFORMANCE REPORT Annual reporting period is from the end of the previous reporting periodor beginning of project for first year grants to 30 days before the due date.
FINAL PERFORMANCE REPORT Final reporting period is from the beginning date of the grant to the end date of the performance period, including the no cost time extension, if appropriate. Final Report is due 90 calendar days after the end date of the performance period.
Must be data or information from the business or grants office. If proposal had “in-kind” contributions, it must be reported here. ANNUAL REPORT: Report the expenditures during the “Reporting Period.” FINAL REPORT: Report the expenditures for the final reporting period, including any no cost time extensions and the total expenditures for the performance period of the entire grant.
INDIRECT COST INFORMATION This section must be completed on both annual and final performance reports. If indirect costs are being charged to the grant (and most everyone does) then “yes” must be checked. To charge indirect costs the agency or institution must have an approved agreement for the % being charged to the grant. The approving agency is where the institution has the most grants; for most institutions it’s HHS.
ANNUAL PERFORMANCE REPORTS This will be checked “No” since OSEP is asking for data for the reporting period, not for the budget period. The date entered here will be the due date for your Final Performance Report; which is 90 days after the end of the grant. Signatory must have authority to sign on behalf of the institution since the grant is from the Department to the institution and not to an individual.
Here you will enter one of the project’s objectives; on subsequent pages, you will enter all of the project’s objectives as submitted in your grant application. However, if your goals are more like measurable objectives and your objectives are more like performance measures, then you will want to enter a goal per page.
Here is where your performance measures go; those written in your grant proposal and/or those program measures that align with the objective. If none of the program measures align with a given Project Objective, then a program measure should NOT be included.
Measure 1.1 – Evidence-Based Practices (Personnel): The percent of personnel receiving professional development through the SPDG based on scientific- or evidence-based instructional practices. Measure 1.2 – State Performance Plan (SPP) Alignment: The percent of SPDG projects that implement personnel development/training activities that are aligned with improvement strategies identified in their SPP. Measure 2.1 – Evidence-Based Practices (Training): The percentage of professional development/training activities provided through the SPDG based on scientific- or evidence-based instructional/behavioral practices. Measure 2.2 – Sustained Practices: The percentage of professional development/training activities based on scientific- or evidence-based instructional/behavioral practices, provided through the SPDG program, that are sustained through on-going and comprehensive practices. (Long-term) Measure 3.1 – Teacher Retention: In states with SPDG projects that have special education teacher retention as a goal, the statewide percentage of highly qualified special education teachers in state identified professional disciplines (e.g., teachers of children with emotional disturbance, deafness, etc.) who remain teaching after the first three years of employment. Measure 4.1 – Scale-up Scientific- or Evidence-Based Practices: The percentage of SPDG projects that successfully replicate the use of scientific- or evidence-based instructional/behavioral practice in schools. (Long-term)
Here you identify if the performance measure was a project measure, “PROJ,” or a program measure, “PRGM.” Note: Program Measures refer to OSEP Measures required in all personnel prep grants. Project Measures are unique to your grant.
QUANTITATIVE DATA For measures that are a single number, e.g., # of workshops or # of students served, the target and actual data are reported as Raw Numbers, e.g., 10 workshops or 10 students. In this case, leave the Ratio and Percentage (%) columns blank.
For Performance Measures that are stated in terms of a percentage (e.g., percentage of students that attain proficiency), complete both the Ratio andthe Percentage (%) columns. In this case, the Raw Number columns are left blank.
Data entered into the Ratio columns should be presented with the numerator representing the numerical target of the original proposal and the actual performance data. The denominators are to represent the universe. Then enter the corresponding %s in the (%) columns.
If the collection of quantitative data is NOT appropriate for a particular project performance measure, then enter “N/A” under the Raw Number and Percentage columns. N/A N/A N/A N/A In this area of the page is where qualitative data can be reported along with other information you wish to report regarding the identified objective.
Final Page of the Report Here is where you can identify the “Program Performance Measures” that you haven’t reported data on through any of your objectives. Also, if you can’t collect and report any data, please explain that here. Our intent is for you to report on all Program Measures, using the APR and the Annual Student Data Collection.
FINAL PERFORMANCE REPORTS This will be checked “Yes” since OSEP is asking for complete data in final reports, not for the budget period. The date entered here will be the due date for your Final Performance Report; which is 90 days after the end of the grant. Signatory must have authority to sign on behalf of the agency or institution since the grant is from the Department to the agency or institution and not to an individual.