Download
1 / 1
10 likes | 116 Views
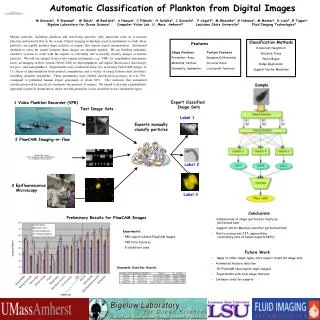
Recent research has led to new imaging instruments producing vast amounts of biological data, challenging manual analysis. This proposes using computer vision methods to automate analysis, measuring parameters like temperature, growth, and stress influence. Active contours and specialized techniques like fluorescence imaging are explored for efficient data interpretation in biological studies.

E N D
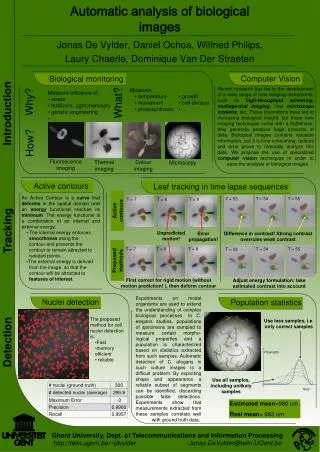
Recent research has led to the development of a wide range of new imaging instruments, such as high-throughput screening, multispectral imaging, new microscope systems, etc. These innovations have led to increasing biological insight, but these new imaging techniques come with a bottleneck: they generally produce huge amounts of data. Biological images contains valuable information, but it is time consuming, tedious and error prone to manually analyze this data. We propose the use of specialized computervision techniques in order to ease the analysis of biological images. • Measure: • temperature • movement • photosynthesis • growth • cell division • … • Measure influence of: • stress • fertilizers, agrochemicals • genetic engineering • … What? Why? Introduction How? Automatic analysis of biologicalimages Fluorescence imaging Thermal imaging Colour imaging Microscopy • An Active Contour is a curve that deforms in the spatial domain until an energy functional reaches its minimum. The energy functional is a combination of an internal and external energy: • The internal energy enforces • smoothness along the • contour and prevents the • contour to remain attracted to • isolated points. • The external energy is derived • from the image, so that the • contour will be attracted to • features of interest. T = 54 T = 55 T = 53 T = 8 T = 9 T = 7 Active contours Tracking Unpredicted motion! Difference in contrast! Strong contrast overrules weak contrast Error propagation! T = 8 T = 9 T = 7 T = 54 T = 55 T = 53 Proposed methods Jonas De Vylder, Daniel Ochoa, Wilfried Philips, Laury Chaerle, Dominique Van Der Straeten First correct for rigid motion (without motion prediction! ), then deform contour Adjust energy formulation: take estimated contrast into account Experiments on model organisms are used to extend the understanding of complex biological processes. In C. elegans studies, populations of specimens are sampled to measure certain morpho-logical properties and a population is characterized based on statistics extracted from such samples. Automatic detection of C. elegans in such culture images is a difficult problem. By exploiting shape and appearance a reliable subset of segments can be identified, discarding possible false detections. Experiments show that measurements extracted from these samples correlate well with ground truth data. Nuclei detection Biological monitoring Leaf tracking in time lapse sequences Active contours Population statistics Computer Vision • The proposed method for cell nuclei detection is: • Fast • memory efficient • reliable Use less samples, i.e. only correct samples Detection P(Length) Use all samples, including unlikely samples Size Estimated mean=980 um Real mean= 983 um Ghent University, Dept. of Telecommunications and Information Processing http://telin.ugent.be/~jdvylder Jonas.DeVylder@telin.UGent.be