Download
1 / 9
90 likes | 214 Views
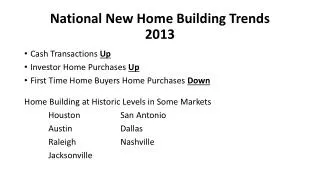
National New Home Building Trends 2013. Cash Transactions Up Investor Home Purchases Up First Time Home Buyers Home Purchases Down Home Building at Historic Levels in Some Markets Houston San Antonio Austin Dallas Raleigh Nashville Jacksonville.

E N D
National New Home Building Trends2013 • Cash Transactions Up • Investor Home Purchases Up • First Time Home Buyers Home Purchases Down Home Building at Historic Levels in Some Markets Houston San Antonio Austin Dallas Raleigh Nashville Jacksonville
National New Home Building Trends – cont.2013 Total Housing Starts in 2013 = 923,000 SFD 618,000 + 15% vs. ‘12 MF 306,000 + 25% vs. ‘12 22 Consecutive Months with House Price Appreciation Slower New Home Sales in 4Q 2013 NAHB Remodeling Market Index (RMI) at Historic High
National New Home Building Trends – cont. 2013 National Headwinds Relative to New Home Building and Sales • Availability of AD&C Financing • High Cost of Developing New Lots • Rising Material Costs • Labor Shortages • Policy Risk
Tale of Two Housing MarketsGreater Louisville Area For Sale New Construction Good News! New “for sale” housing construction up the last two years vs. down the previous five years Bad News New “for sale” construction still only at 60% of the 2002 numbers
Tale of Two Housing Markets – cont.Greater Louisville Area Existing Housing Market At best performance levels in last tenyears Highest Average Sales Price Highest Median Sales Price Lowest Average Days on the Market Highest number of sales since 2006
ULI National SurveyAmerican’s Views on Their Communities,Housing & Transportation 7 in 10 renters are hopeful that in 5 years they will own a home 9 in 10 report satisfaction with their current residence 4 in 5 are happy with the range of housing choices in their communities 2/3 live in SFD housing Among those planning on moving in 5 years; 2/3 expect that move to be a SFD home 7 in 10 believe buying a home is a good investment
ULI National Survey – cont. American’s Views on Their CommunitiesHousing & Transportation GenY/Millennials (ages 18-34) • 7 in 10 expect to own a home in the next 5 years • Car dependent for commuting (77%) • More likely to seek a mix of uses when seeking a home to purchase • Most likely to want walkable communities and prefer transit • Will trade a short commute for a larger home
ULI National Survey – cont.American’s Views on their Communities,Housing & Transportation GenX (ages 35-41) Most likely to own a home (81%) and live in a SFD home (87%) Least likely to rent (16%) 92% commute by car
ULI National Survey – cont.American’s Views on their Communities,Housing & Transportation Baby Boomers (48-66) Not likely to move soon, but when they do move they desire smaller homes and shorter commutes Want to live near parks and apart from neighbors Want to live where homes are alike Least likely to seek living in mixed use Least likely to value walkability 90% commute by car