Chapter 4 – Distance methods
Chapter 4 – Distance methods Distance sampling (or called plotless sampling) is widely used in forestry and ecology to study the spatial patterns of plants. Numerous mathematical models based on distance sampling have been developed since the 50’s.

Chapter 4 – Distance methods
E N D
Presentation Transcript
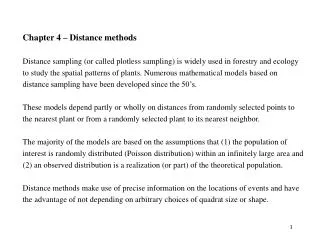
Chapter 4 – Distance methods Distance sampling (or called plotless sampling) is widely used in forestry and ecology to study the spatial patterns of plants. Numerous mathematical models based on distance sampling have been developed since the 50’s. These models depend partly or wholly on distances from randomly selected points to the nearest plant or from a randomly selected plant to its nearest neighbor. The majority of the models are based on the assumptions that (1) the population of interest is randomly distributed (Poisson distribution) within an infinitely large area and (2) an observed distribution is a realization (or part) of the theoretical population. Distance methods make use of precise information on the locations of events and have the advantage of not depending on arbitrary choices of quadrat size or shape.
100 80 ri 60 y ri 40 x 20 ri 0 20 40 60 80 100 x • Two types of distance measures: from tree to tree and from point to tree. • In general a buffer zone is needed to eliminate edge effect.
Nearest neighbor distance index This index is the simplest one, based on the distance from a tree to its nearest neighbor. It was first developed by Clark and Evans (1954). It is defined as where R = the nearest neighbor index = average distance from randomly selected plants to their nearest neighbors = expected mean distance between nearest neighbors. Under the Poisson distribution with intensity l, we have * Clark, P.J. and Evans, F.C. 1954. Distance to nearest neighbor as a measure of spatial relationships in populations. Ecology 35:445-453.
Testing the nearest neighbor distance index • The ratio R provides a method for detecting the degree to which the observed distance departs from random expectation. In a regular distribution, R would be significantly greater than 1, whereas in an aggregated distribution R would be significantly less than 1. To test the null hypothesis (H0) that the observed distance is from a randomly distributed population, we have • where and • Two-tail test: p-value = p(|z| zobs). Large |zobs| value has small p-value, evidence against H0, suggesting aggregated or regular pattern. • One-tail test: p-value = p(zzobs) for testing regularity, or p-value = p(zzobs) for testing aggregated pattern.
• r • r1 • • Derivation of the nearest neighbor distance We now go on to show how the nearest neighbor distance was derived. Assume a population of organisms randomly distributed with intensity l, the probability of x individuals falling in any area of unit size is Then, the number of individuals in a circle of radius r follows a Poisson distribution with mean lr2: Similarly, the probability that the number of individuals in the annulus between the concentric circles radii r and r1 is
• r • r1 • • The probability for the nearest neighbor distance r can be derived as follows. p(r) p(circle r is empty, but individuals occur in the annulus) = p(circle r is empty) p(individuals occur in the annulus) It is straightforward to compute the two probabilities: The first probability is: The second probability is: Therefore,
The probability for the nearest neighbor distance r is obtained by assuming r1 r: Thus, the pdf for the nearest neighbor distance r is a Weibull distribution: Mean: Variance: Need to use the gamma function:
Clark & Evans Nearest Neighbor Index 80 60 40 20 0 0 20 40 60 80 100 An example for the nearest neighbor distance We test the spatial pattern for the western hemlock in the Victoria Watershed plot. There are 982 hemlock stems in the 10387 m plot. The procedure is as follows. • Randomly choose 200 stems, • Measure the distance for each of these 200 stems to its nearest neighbor, • Average these 200 distances (= 1.0458), • Calculate the expected mean distance (= 1.5104), • Compute the density l = 0.1096, • The nearest neighbor index R = 0.6924, • Calculate the standard error sr = 0.05582, • Calculate the z-value = (1.0458-1.5104)/0.05582 = -8.3232, • p-value = p(zzobs) = p(z -8.3232) = 0, • Conclusion: Reject null hypothesis of random distribution; strong evidence for aggregated spatial pattern. • R: distance.main(hl.xy,200,”event.event”)
For Victoria HL: The nth nearest neighbor distance Thompson (1956) proved that the mean distance to the nth nearest neighbor is Observed Hemlock CSR expectation CSR expectation Observed Hemlock Thompson, H.R. 1956. Distribution of distance to nth neighbour in a population of randomly distributed individuals. Ecology 37:391-394.
Hubbell, S.P. et al. 2008. How many tree species are there in the Amazon and how many of them will go extinct? PNAS 105:11498-11504
Index of point to plant distances First proposed by Pielou (1959), is based on the distances from randomly chosen points to their respective nearest events (trees). The index is defined as where a = Pielou’s index of non-randomness l = average density of events per unit area = mean squared distance between randomly chosen points to their nearest neighbors. For randomly distributed population, it is For observed distances, it is calculated as (ri is the distance from the ith point to its nn) * Pielou, E.C. 1959. The use of point-to-plant distances in the study of the pattern of plant populations. Journal of Ecology 47:607-613.
Test statistics for Pielou’s index • It can be shown that 2na ~ c22n. (Sketch of the derivation: Following the Weibull distribution on p.7, it is easy to show that has an exponential distribution: f() = e- = e- ( is the density per unit circle). Then the sum of ’s follows a gamma distribution of which c2 is a special case.) • Thus, • Test for the hypothesis of random pattern: • p-value = p(c22n> 2na) for testing aggregated pattern of distribution. Large 2na value has small p-value, evidence against H0, suggesting aggregated patterns. • p-value = p(c22n< 2na) for testing regularity. Small 2na value leads to small p-value, evidence to suggest regular patterns. (Unbiased estimator)
Hopkins and Skellam’s coefficient of aggregation This test is based on the assumption that a population is randomly distributed if the distribution of distances from a random point to its nearest neighbor is identical to the distribution of distances from a random plant to its nearest neighbor. The index is defined as the ratio of the sum of the squared distances from point-to-plant (1) to the sum of the squared distances from plant-to-plant (2): A = 1 for a randomly distributed population A > 1 for an aggregated population A < 1 for a regular population. To test whether A departs significantly from its expectation of 1, the sampling distribution for the following statistic is derived: Hopkins, B. (with an appendix by Skellam, J.G.) 1954. A new method for determining the type of distribustion of plant individuals. Ann. Bot., London, N.S. 18:213.
Standard beta distribution: x ~ Beta distribution It is not difficult to show that x follows a beta distribution. That is where The mean and variance of the beta distribution are: Note (same for v):
Test for x • x = 0.5 is for random distribution • x > 0.5 is for aggregated distribution • x < 0.5 is for regular distribution • For a large sample size n, x tends towards normality. We have • Therefore, a statistical decision can be made based on the size of p-value: • p-value = p(z>zobs) for testing aggregated pattern of distribution. Large zobs value has small p-value, suggesting an aggregated pattern. • p-value = p(z<zobs) for testing regularity. Small zobs value leads to small p-value, evidence for a regular pattern.
1.0 1.0 0.8 0.8 0.6 0.6 0.4 0.4 0.2 0.2 0.0 0.2 0.4 0.6 0.8 0.0 0.2 0.4 0.6 0.8 1.0 1.0 1.0 1.0 0.8 0.8 0.6 0.6 0.4 0.4 0.2 0.2 0.0 0.0 0.8 0.0 0.2 0.4 0.6 0.8 0.0 0.2 0.4 0.6 Spatial relationships between two species Segregated species Unsegregated species Random pattern Aggregated pattern
Index of species segregation Segregation is the degree to which the individuals of two (or more) species tend to separate from one another. We have learned that quadrat counts could be used to test the association of two species, but the results are strongly influenced by quadrat size. An alternative approach which overcomes this problem is based on distance sampling. Assume there are two species, we randomly select an individual plant and locate its nearest neighbor and then record the species type. This process is repeated N times. The data can be summarized in a contingency table similar to the one for the quadrat counts.
Index of segregation (Kappa statistic) Pielou (1961): Cohen (1960): where Note: With a large sample size, ~ N(0,1) * Pielou, E.C. 1961. Segregation and symmetry in two-species population as studied by nearest-neighbor relationships. Journal of Ecology 49:255-269
What we have learned? • The concept of nearest neighbor distances • Tree-to-tree (event-to-event) distances (Clark & Evans 1954) • Point-to-tree distances (Pielou 1959) • Hopkins and Skellam’s index of aggregation (Hopkins 1954) • Index of species aggregation (kappa statistics)