Download

1 / 35
360 likes | 547 Views
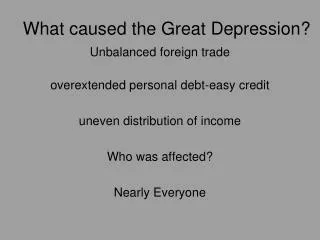
“Bubble Boom, Bubble Bust- 9 Steps to the Next Great Depression ”. presented by Harry S. Dent, Jr. Timeline of Depressions. 60. 80. 2070s. 2010s. 60. 35. 60. 1930s. 40. 60 Years. 1870s. 1840s. 1780s. 1740s. 1680s. CRB Index (Log) vs S&P 500 1790-2007. S&P 500. CRB Index.

E N D
“Bubble Boom, Bubble Bust-9 Steps to the Next Great Depression” presented by Harry S. Dent, Jr.
Timeline of Depressions 60 80 2070s 2010s 60 35 60 1930s 40 60 Years 1870s 1840s 1780s 1740s 1680s
CRB Index (Log) vs S&P 5001790-2007 S&P 500 CRB Index 1930s 1870s 1780s 1890s 1840s
CRB Index vs S&P 5001816-1845 S&P 500 48% Decline CRB Index
US Canals1802 - 1860 Source: Historical Statistics of the United States
CRB Index vs S&P 5001860-1878 S&P 500 36% Decline CRB Index
Miles of Railroad Built 5 B 3 1 A 4 C 2 Source: Historical Statistics of the United States
CRB Index vs S&P 5001870-1897 S&P 500 24% Decline 36% Decline 28% Decline CRB Index
CRB Index vs S&P 5001922-1942 S&P 500 72% Decline CRB Index
9 Steps to the Bubble Bust 1) Tech Bubble Top – 3/20002) Adverse Geopolitical Cycle – 9/20013) Housing Bubble Top – 7/20054) Emerging Markets Top – Late 2008?5) Tech S-Curves Hit 90%, Second Tech Top – Late 20086) Decennial Cycle – Late 20097) 4-Year Cycle – Late 20098) Inflation/Commodity Bubble Top – Late 2009 – Early 20109) Spending Wave Top/80-Year Growth Boom – 2008 - 2011
Nasdaq Composite1998-2025 5 B D E C A Source: Yahoo Finance
Long Term House Prices vs. Inflation Source: Robert J. Shiller, Irrational Exuberance, 2nd Edition, Princeton University Press, 2005.
Real Estate Spending Cycles Vacation Homes Trade-Up Homes 48 Starter Resorts Homes Spending Apartments 42 55 Vacation/ Retirement Shopping Centers Homes Offices Consumer Colleges 31 Life Cycle 63 26 21 18 20 24 28 32 36 40 44 48 52 56 60 64 68 Age
Brazil Bovespa vs. Nasdaq May-10 May-02 May-03 May-04 May-05 May-06 May-07 May-08 May-09 Jan-99 Jan-00 Jan-01 Jan-02 Jan-98 Jan-97 Jan-95 Jan-96 Jan-94
India Sensex Index vs. Nasdaq Jun-10 Jun-02 Jun-03 Jun-04 Jun-05 Jun-06 Jun-07 Jun-08 Jun-09 Jan-99 Jan-00 Jan-01 Jan-02 Jan-98 Jan-97 Jan-95 Jan-96 Jan-94
Shanghai Composite Index vs. Nasdaq Jul-10 Jul-09 Jul-05 Jul-06 Jul-07 Jul-08 Jul-04 Jul-03 Jul-02 Jan-99 Jan-00 Jan-01 Jan-02 Jan-98 Jan-97 Jan-95 Jan-96 Jan-94
Mobile Phone S-Curve Innovation Growth Maturity 100 90% 90 86% 2007 82% 80 2006 77% 73% 2005 70 63% 2004 58% 60 Percent of Households 2003 50% 2002 50 47% 40 2000 30 13% 20 10% 1995 .1% 10 2% 1990 0 2001 1994 2008 Time Source: Forrester, Census Bureau
Internet S-Curve Innovation Growth Maturity 100 90% 90 79% 74% 73% 2007 80 71% 2006 67% 70 2005 2003 2004 66% 61% 60 2002 50% Percent of Households 2001 50 40 31% 1999 30 22% 1998 20 17% 1997 10 10% 0 1993 2000 2007 Time Source: Forrester, Census Bureau
Broadband S-Curve Innovation Growth Maturity 100 90% 90 80% 80 2007 70 63% 2006 60 Percent of Households 50% 50 37% 40 2004 30 22% 2002 20 10% 10 0 2000.5 2004.5 2008.5 Time Source: Pew Internet
Decennial Pattern Since 1900Dow Industrials - Average 10-Year Decennial PatternWeekly Data 1/6/1900-12/31/1999 Source: Ned Davis Research, www.ndr.com
4th Presidential Year 1st Presidential Year 2nd Presidential Year 3rd Presidential Year Four Year Presidential Cycle Source: Ned Davis Research, www.ndr.com
29-30 Year Commodity Price CycleCRB Index (PPI before 1947) 2038-39 2009-10 1980 1920 1951
Historical Price of Oil1946-Present 5 5 3 4 3 b 1 2 a c 4 1 2 Source: Dow Jones Energy Service
Inflation Forecast 20 Year-Olds on a 3-Year Lag Minus 63 Year-Olds Inflation Source: U.S. Census Bureau and U.S. Bureau of Labor and Statistics
80-Year New Economy Cycle Growth Boom Innovation Shake-Out Maturity Boom Innovation Spending Wave We Are Here Innovation/ Inflation Stable Prices Stable Prices Inflation Disinflation Deflation Inflation 2038 1968 1978 1988 1998 2008 2018 2028
Top 1% Share of U.S. Household Wealth The rich quickly recovered from the tech bust 1929 Stock Market Peak Market crash and tax policy hit the rich hard Source: Edward Wolff, as printed in Wealth and Democracy
Distribution of Asset Ownership By Wealth Percentile in 2004 Common Stocks Housing Equity Financial assets dominated by the richest… …but real estate is dominated by the common man Source: The State of Working America 2006/2007