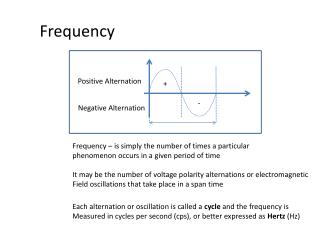
Frequency Diagrams
Frequency Diagrams. By Mr. Swatanter Singh PGT (ECO.) KV HISAR CANTT. Previous knowledge testing. What do you mean by presentation of data ? What is frequency ? What is bar diagram ? What is cumulative frequency ? What is continuous variable ?. Types of frequency diagrams. Histogram

Frequency Diagrams
E N D
Presentation Transcript
Frequency Diagrams By Mr. Swatanter Singh PGT (ECO.) KV HISAR CANTT.
Previous knowledge testing • What do you mean by presentation of data ? • What is frequency ? • What is bar diagram ? • What is cumulative frequency ? • What is continuous variable ?
Types of frequency diagrams • Histogram • Frequency polygon • Frequency curve • Ogive
Histogram Histogram is a graphical presentation of frequency distribution. It is in the form of adjacent rectangles. It is a two dimensional diagram. It means height and width of rectangular bars both are important for the comparison of data.
Frequency PolygonTwo methods • Ist method : Frequency Polygon is drawn by joining the mid points of the top sides of the consecutive rectangles. • IInd method :The frequency polygon may be drawn by connecting points plotted against the frequencies at the midpoints of the classes.
Frequency Curve Frequency curve is a smooth free hand curve passing through the points of frequency polygon as closely as possible.
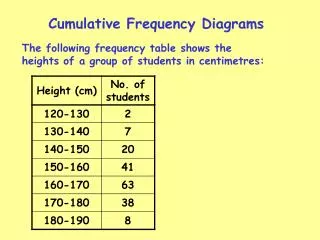
Ogive Ogive is a cumulative frequency curve. Two Types : Less than Ogive : is obtained by joining the points for cumulative frequencies plotted against the upper class limit of class intervals. More than Ogive : is obtained by joining the points for cumulative frequencies plotted against the lower class limit of class intervals.
Determination of median Median is the value corresponding to the intersection point of less than and more than ogives.
Uses 0f Frequency Diagrams • to display large amounts of data in a relatively simple chart form. • to tell frequency of occurrence. • to easily see the distribution of the data. • to see if there is variation in the data. • to make future predictions based on the data.
Define histogram. Define frequency polygon. Plot histogram and frequency polygon for the given set of data: Define ogive. How Median is graphically determined ? Exercise