Download
1 / 11
690 likes | 2.1k Views
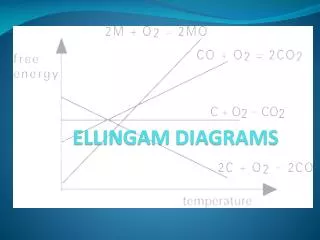
ELLINGA ELLINGAM DIAGRAMS M DIAGRAMS. Ellingham diagrams are plots of Δ f G o with respect to T for reactions, like formation of oxides , sulfides etc. of various elements .

E N D
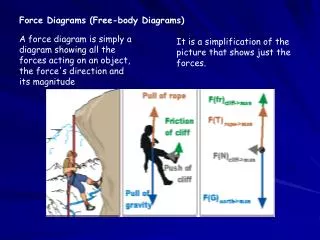
Ellingham diagrams are plots of Δf Gowith respect to T for reactions, like formation of oxides, sulfides etc. of various elements. The main application of Ellingham diagram is in the metallurgy industry, where it helps to select the best reducing agent for various ores in the extraction process. For a particular reaction ,ΔH andΔS remain almost constant even on changing temperature. In general, the plot of ΔG vs T, is a straight line with a positive slope.
In Ellingam diagram ,an oxide at a lower position is more stable than an oxide at a higher position. A reaction for which ΔG is -ve ,can be made spontaneous by coupling it with another reaction ,which has more –veΔG value. We can use Ellingam diagram to select a suitable reducing agent for extraction of a metal from its ore. Any element, whose plot is at a lower position in Ellingam diagram ,can reduce the oxide of the element, which occupies a higher position. Larger the difference in ΔG values for the two reactions coupled together ,easier is the reduction reaction.
In some cases , there is an abrupt change in the slope, this is due to change in phase (solid → liquid ) or ( liquid→ gaseous ).
Limitations of Ellingam Diagram • It does not say anything about the kinetics of the reduction process ie how fast or how slow the process will be. • Interpretation of ΔG is based on equilibrium constant ΔG = -RTlnK It is presumed that reactants and products are at equilibrium ,which is not always true, as reactants and products may be solids.
QUESTIONS • Under which condition (a)can Mg reduce Al2O3 (b)can Al reduce FeO? • Out of C or CO, which one is a better reducing agent at 673K? why? • Why Zn is not extracted from ZnO using CO as reducing agent? • ΔG of Cr2O3 is -540kj/mol and ΔG of Al2O3 is -827kj/mol Is reduction of Cr2O3 possible with Al? 5. Out of C or CO,which one is a better reducing agent for ZnO? Why?
ANSWERS • Below 1350oC Mg can reduce Al2O3 • Above 1350oC Al can reduce MgO. • CO is a better reducing agent at 673K,because Δf Go for reaction 2CO+O2=2CO2Is more –ve than Δf Go for the reaction 2C+O2=2CO or C+O2=CO2 • The reaction may require very high temperature. • Yes • Carbon. Since Δf Go C,CO is more –ve and the graph lies at a lower position than that for (Zn,ZnO)in Ellingam Diagram.