Download

1 / 14
140 likes | 160 Views
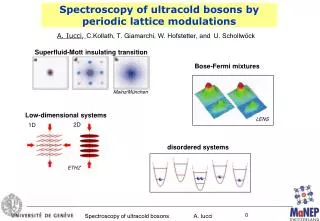
Explore the superfluid-Mott insulating transition and Bose-Fermi mixtures in ultracold bosons through periodic lattice modulations. Investigate the energy spectrum, density-density correlations, and more. Experimental results and methods like adaptive t-DMRG and linear response are discussed.

E N D
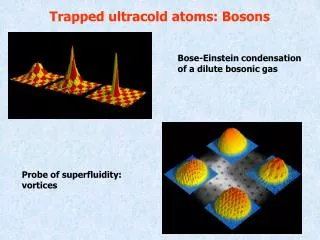
Spectroscopy of ultracold bosons by periodic lattice modulations 2D 1D A. Iucci,C.Kollath, T. Giamarchi, W. Hofstetter, and U. Schollwöck Superfluid-Mott insulating transition Bose-Fermi mixtures Mainz/München Low-dimensional systems LENS disordered systems ETHZ
Probing cold atoms time-of-flight measurement -> momentum distribution periodic lattice modulation -> energy spectrum Mainz/München & (in)commensurability noise measurement: -> density-density correlations ETHZ Mainz
Experimental resultsResponse to a periodic modulation • periodic modulation of • optical lattice height • absorbed energy T. Stöferle et al. PRL 92, 130403
Bosonic atoms in an optical lattice interaction energy kinetic energy experimental parameter -> J and U periodic modulation of lattice height -> time dependent J(t) and U(t) explicitly time-dependent Hamiltonian Methods: - adaptive t-DMRG - linear response
Strong interaction U 2U 3U response to periodic modulation -> creation of excitations single particle hole excitation -> energy U two particle hole excitations -> energy 2U -> expect peaks at multiples of U • absorbed energy ħw
Energy absorption L=32 L=24 at resonance ħw=U • absorbed energy away of resonance C. Kollath et al. cond-mat 2006
Energy absorption at commensurate filling experiment U/J =72 U/J =95 • absorption rate U 2U ? • peak at U • small peak at U/2 • no peak at higher frequencies linear response: A. Iucci et al. accepted by PRA
Energy absorption at incommensurate filling experiment experiment U/J =95 n~1.2 U/J =72 • absorption rate • peak at U • peak at 2U
2U peak corresponding processes single particle-hole excitation two particle-hole excitations 2U peak measure of incommensurability
Intermediate interaction strength experimental results: 1.9U U U/J =28 2.6U • absorbed energy peaks at U, 1.9 U, and 2.6 U peaks at approx. U, 1.9 U, and 2.6 U T. Stöferle et al. PRL 92, 130403
Energy absorption at incommensurate filling U/J =9 n~1.2 • absorption rate • peaks at U, 2.1 U, and 2.6 U • shift of position of energy eigenvalues at incommensurate filling
Positions of peaks • small system at incommensurate filling: • position shifts, • splitting of peaks 0.1 0.2 0.3 J/U
20% perturbation -> beyond linear response absorption rate, 1% modulation (scaled) absorption rate, 20% modulation integrated absorption, 20% modulation saturation effects occur in height and width
Summary • occurence of higher frequency peaks for incommensurate filling: confining potential, temperature • shift in peak position stem from shift in energy • 20% perturbation -> saturation effects in width and height • not described by linear response • full time-dependent calculation: adaptive t-DMRG • many more applications possible