Download
1 / 14
140 likes | 323 Views
Best Practices & Lessons Learned from Hurricane Evacuation Efforts. James E. Mitchell, Ph. D. IT GIS Manger NOAA Hydrographic Services Review Panel Gulf of Mexico Public Meeting New Orleans, Louisiana November 28, 2012. What Is “0”? Where Did It Come From?. Datums NAD 1927 - NGVD 1929

E N D
Best Practices & Lessons Learned from Hurricane Evacuation Efforts James E. Mitchell, Ph. D. IT GIS Manger NOAA Hydrographic Services Review Panel Gulf of Mexico Public Meeting New Orleans, Louisiana November 28, 2012
What Is “0”?Where Did It Come From? • Datums • NAD 1927 - NGVD 1929 • NAD 1983 – NAVD 1988 • NAD 1983 HARN… • Spheroids, Geoids, Ellipsoids… • Whatever happened to good-old benchmarks?
Without Knowing Something About “0” We Remain in the Dark
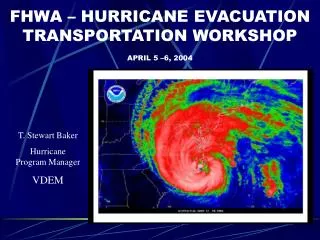
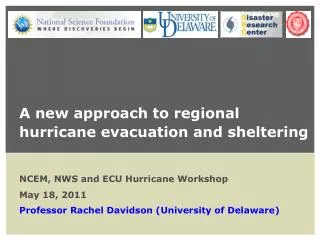
Road Elevations Are Criticalin Coastal Louisiana As a storm approaches, road elevations collected using GPS are compared against MOMs and MEOWs to assess risk to flooding.
How Do We Decide if a Road Will Flood? • Road Elevation Survey • Tide and River Gauges • Storm Surge • MOMs • MEOWs • Operational Forecasts • Wave Height Forecasts This only works when all of these figures are in the same reference frame…
LESSON #1 – It’s Elevation – Stupid! • To determine if target objects (roads, buildings, etc.) will flood, you need to receive water-level data/forecasts as elevations • It is impossible to determine flood risk from data provided as, “flood depth” or “above ground level” (AGL) because they have no datum • The less processing required of forecast data, the faster flood risk can be assessed, interpreted, and communicated to decision-makers
Who Has the Real Coastline? Red features are from the NHD. Orange polygons are areas represented by NOAA as land in 1940 (most current data). These are now open water in the NHD.
Maps, Data, & Imagery Do Not Match The yellow lines are where best-available digital data show the land-water boundary. The image is post hurricane orthophotography. Neither match the maps.
LESSON #2 – Maps and Pictures are Static • Maps are out of date and not updated frequently enough to keep up with the dynamic landscapes of the deltaic systems of coastal Louisiana • Geospatial data is often derived from old maps and are often not kept current • Aerial imagery may be current but requires extensive interpretation before it can be used as geospatial data
LESSON #3 – Practice Makes Perfect • Drills are important and help develop confidence in data processing workflows • Drills need to include “live” data elements that develop data flows and test data accessibility • Drills need to cross agency lines to develop interoperability
LESSON #4 – Emergencies are Data Intensive • It is easy to encounter data gaps in an emergency • It is possible to be overwhelmed by the volume of data during an emergency • There is a large gap between data sources and decision-makers • Decision-makers do not ant to analyze data – they want answers • Data analysis needs to be performed across the entire organization, by the people who know the data and how to use it
Mitchell’s Three Rules of GIS • Everything you know is WRONG!Data is inherently fraught with errors and uncertainty. Beware of this and account for it in your decisions. • There is a thousand ways to do anything… - but there are only a couple that are RIGHT!Data is handled in many ways. Not all may be appropriate for your application. Understand how your data are processed. • There is more data than you can ever use - but you can never find what you NEED!Prepare for your data needs, a priori. Have all the data you need at hand for all possible contingencies or know where to get it.
LESSON #5 – “Best Available” Datais not an Excuse for Deficient Data • Inadequate data can lead to bad decisions • Everyone is responsible to ensure that data are sufficient address the problem at hand • Decision-makers need to be aware of how adequate the data are to address their needs